Method Article
DNA-barcode-based Multiplex Immunofluorescence Imaging to Analyze FFPE Specimens from Genetically Reprogrammed Murine Melanoma
* These authors contributed equally
In This Article
Summary
This protocol provides a step-by-step guide for designing a multiplex immunofluorescence antibody panel for DNA-barcode-based imaging of murine FFPE melanoma tissues. We also describe an image analysis pipeline using open-source tools for generating spatial proteomics insights into the murine melanoma tumor immune microenvironment.
Abstract
Presented here is an emerging DNA-barcode-based multiplex imaging technique based on Co-Detection-by-indEXing that analyzes the spatial proteomics of tissue microenvironments. Successful imaging requires a repertoire of well-designed and properly validated antibody panels, but very few currently exist for formalin-fixed paraffin-embedded (FFPE) samples. FFPE offers several advantages over fresh-frozen specimens, such as widespread availability, ease of handling and storage, and the ability to make tissue microarrays (TMAs). Here, we present a protocol to develop an antibody panel for visualizing and analyzing FFPE tissues from a murine melanoma model treated with nanoparticles, which deliver plasmid DNA encoding immunologic signals for tumor microenvironment reprogramming. We also describe an image analysis pipeline using open-source computational tools for annotating tissues, segmenting cells, processing proteomics data, phenotyping cell populations, and quantifying spatial metrics. The protocol offers applications for designing antibody panels in murine FFPE and generating novel insights into the spatial proteomics of complex tissue microenvironments.
Introduction
Cutaneous melanoma is the most common skin cancer, with varying disease and mortality rates across the globe depending on the time of diagnosis and primary care1. Over the last decade, an increased biological understanding of melanoma has helped propel the development of new cancer models to treat solid tumors2. The recent rise of immunotherapy has led to a revolutionary concept of cancer treatment based on activating the endogenous immune system3,4.
The tumor microenvironment (TME) is highly complex, consisting of diverse immune cells, cancer-associated fibroblasts, pericytes, endothelial cells, and various tissue-resident cells5. Several techniques have been applied in the past to study the TME, such as flow cytometry and single-cell sequencing, which compromise spatial context as they are required to destroy the tumor tissue. Traditional microscope imaging, such as immunofluorescence (IF) and immunohistochemistry (IHC), allows the visualization of protein biomarkers without destroying sample tissues. However, these approaches are limited to two or three biomarkers and are unable to provide a full understanding of spatial and structural relationships within the complex TME 6.
To address this problem, several multiplex imaging techniques have been developed to visualize the complex TME spatially7,8,9,10. One of these is CoDetection-by-inDEXing, renamed as the PhenoCycler system, based on DNA oligonucleotide-conjugated antibodies11. The system can provide single-cell imaging and analysis of over 100 biomarkers for human specimens. However, very few inventoried antibodies are available to visualize and analyze murine specimens, particularly Formalin-Fixed Paraffin-Embedded (FFPE) samples12. FFPE offers several advantages over Fresh Frozen (FF) preservation, such as ease of handling and storage, well-preserved morphology over time, and, most importantly, the ability to prepare tissue/tumor microarrays (TMA) that allow for visualization of several specimens on a single slide. We recently designed and developed a murine FFPE CODEX/PhenoCycler antibody panel and successfully applied it to visualize and analyze the spatial proteomics of genetically reprogrammed murine melanoma specimens13.
The overall goal of this protocol is to provide a step-by-step guide for designing a murine FFPE antibody panel and describe the process of antibody-barcode conjugation, tissue staining, and imaging. Additionally, we present a detailed image analysis pipeline utilizing open-source tools such as QuPath and R packages. After following this protocol, researchers will learn how to design a custom-conjugated antibody panel, perform multiplex imaging using a Phenocycler-Fusion device, and gain new insights into the spatial proteomics of the melanoma TME. Furthermore, this protocol can be adapted to study various tumor immune microenvironments and combined with existing spatial transcriptomics techniques.
Protocol
All animal work was performed in accordance with the guidelines set by the Johns Hopkins Animal Care and Use Committee, using the approved protocol numbers MO18M388 and MO21M384.
1. Antibody selection
- Design an antibody panel based on the tissue of interest and the abundance of the particular biomarker. Choose antibody clones based on successful previous applications of immunofluorescence (IF) and immunohistochemistry (IHC) staining in the literature. Secure carrier-free versions of these antibodies.
NOTE: A purified antibody free from carrier is important for the barcode conjugation. Avoid any protein-based preservatives such as BSA, gluten, glycerol, etc. If the carrier-free antibody is unavailable, request a custom antibody from the supplier or use a BSA removal kit to make the carrier-free antibody. Sodium azide does not interfere with antibody conjugation. IgG isotypes are recommended over IgM isotypes. - Verify these selected clones on the tissue of interest using conventional immunofluorescence (IF) imaging11. Use double IF imaging to confirm the specificity of certain clones (e.g., perform double-IF imaging with FOXP3 and CD4 to confirm staining for regulatory T cells).
NOTE: Whenever possible, it is important to use the same tissue for IF validation that will be used for staining. Select the appropriate antigen retrieval solution. In this protocol, we used an AR9 buffer supplied by Akoya Biosciences to retrieve all murine melanoma FFPE tissue epitopes. Other antigen retrieval solutions, such as AR6 or Universal, can be used based on the epitope requirements.
2. Antibody conjugation and confirmation
- Assign verified antibodies to barcodes that have complimentary reporters attached to ATTO550 (Cy3), AF647 (Cy5), or AF750 (Cy7) fluorophores. Low-abundant antigens usually produce lower signals; conjugate such antibodies to low autofluorescence channels such as AF647 (Cy5). Conjugate highly expressed antigens to ATTO550 (Cy3) and AF750 (Cy7) due to the possibility of autofluorescence.
NOTE: This critical step considers channel sensitivity and antigen abundance. Using the AF488 channel for FFPE tissue is not recommended due to its higher autofluorescence. - For antibody-barcode conjugation (4.5 h), obtain the antibody conjugation kit. Store all reagents at 4 °C except reduction solution 1, which needs to be stored at -20 °C as small one-time-use vials.
- Measure antibody concentration by using a spectrophotometer.
- Start antibody conjugation by applying 500 µL of the filter-blocking solution to a 50 kDa MWCO filter column to block the non-specific binding of antibodies to the filter. Spin down at 12,000 x g for 2 min at room temperature (RT). Remove extra liquid from the column using a 200 µL micropipette.
NOTE: Reduction solution 1 is a single-use solution vial, which is enough for three antibody conjugations at a time. Do not reuse the solution after thawing; discard any remaining reagent. Do not use a filter over the 50 kDa MWCO filter column, as this can result in poor purification and conjugation. - Use a 50 µg equivalent volume of the antibody solution and add it to a 50 kDa MWCO filter. Adjust the total volume to 100 µL using PBS if needed. Spin down at 12,000 x g for 8 min at 4 °C. During this time, prepare the reduction master mix using 19.8 µL of reduction solution 1 + 825 µL of reduction solution 2 for three antibody conjugations.
- Discard flow-through and add 260 µL of reduction master mix to the top of each filter unit. Vortex solution in the filter unit for 2-3 seconds and incubate for 30 min at RT.
NOTE: It is critical not to exceed 30 min incubation to avoid over-reduction of antibodies, as this damages them and can result in failed conjugation. - After 30 min incubation, spin down at 12,000 x g for 8 min at 4 °C, and discard flow through at the bottom. Add 450 µL of conjugation solution to the top of the column and spin down at 12,000 x g for 8 min at 4 °C. During centrifugation, prepare the CODEX barcode solution. Move quickly after retrieving the barcode from -20 °C, as the barcode starts degrading.
NOTE: Barcodes are usually supplied in small glass vials containing lyophilized products (flakes or powder) stored at -20 °C. These vials can be used to conjugate 50 µg of antibody at once. It is recommended not to conjugate more than three antibodies at a time. - Carefully locate the lyophilized barcode at the bottom of the glass vial (it may also be stuck to the walls). Tap the glass vial on a table to bring the solids to the bottom. Locating the lyophilized product is essential when dissolving it in 10 µL of nuclease-free molecular biology-grade water. After adding 10 µL of nuclease-free water, add 210 µL of conjugation solution to each barcode. Dissolve all lyophilized material and mix gently by pipetting up and down. Set aside.
- After completing the spin in step 2.2.5, discard the flow-through and add the respective barcode solution from step 2.2.6 to the top of each filter unit. Save 1 µg of the initial unconjugated antibody; this will be run along with the conjugated 5 µL antibody sample during gel electrophoresis validation.
- Label each tube with the respective antibody and barcode name. Close the lid and mix the solution by vortexing for 2-3 s. Incubate the antibody-barcode conjugation reaction for 2 h at RT.
- After 2 h incubation, remove 5 µL of conjugated antibody and store in a 0.2 mL PCR tube to confirm the conjugation by gel electrophoresis.
- Spin down the remaining conjugated antibody solution at 12,000 x g for 8 min at 4°C. Add 450 µL of purification solution to the top of the column, spin at 12,000 x g for 8 min at 4 °C, and discard the flow through. Repeat this purification step 2x, adding 450 µL purification solution each time and spinning it down.
- After the 3rd centrifugation, discard the flow through. The top filter will contain the barcode-conjugated antibodies.
- To collect the conjugated antibody, label the new outer tube that holds the filter column with the corresponding antibody and barcode. Cut the lid off of the outer tube before centrifugation. Add 100 µL of antibody storage solution to each filter unit and place the newly labeled outer tube upside down on top of the filter column.
- Invert the filter column to collect the conjugated antibody into the outer tube and spin down at 3,000 x g for 2 min at RT. This should collect about 120 µL of conjugated antibody solution. Transfer to a sterile microcentrifuge tube and store at 4 °C for 18-24 months.
NOTE: To avoid high background nuclear staining after conjugation, it is recommended that these antibodies not be used for at least 2 days.
- Perform conjugation confirmation by gel electrophoresis as described in already published protocol13.
NOTE: This process only confirms the success of the chemical conjugation reaction used to conjugate the barcodes with antibodies. It is optional, as antibody validation is only possible after successful staining and imaging of the tissue.
3. Murine FFPE specimen preparation
- Obtain FFPE tissue samples from C57BL/6J female mice implanted with B16F10 flank tumors. Treat mice with intratumoral injections of poly(β-amino ester)-based nanoparticles containing 4-1BBL and IL-12 plasmids, along with intraperitoneal delivery of anti-PD1 at 9, 11, 16, and 18 days post-implantation14. Sacrifice mice on day 20 and fix tumors in 10% formalin, embedded in paraffin, then section at the Johns Hopkins Oncology Tissue Services core.
- Carefully consider the imaging area specifications provided in the user manual and mount 5 µm specimens on a slide inside the imaging area. We were able to mount four different tumor specimens on a single slide.
NOTE: It is essential to use the recommended slides available for imaging, such as Leica Apex Adhesive Slides or Fisherbrand Superfrost Plus Slides. This will help the flow cell adhere firmly to the slide.
4. FFPE tissue staining and imaging
- Verification and optimization of antibody concentration and exposure times: To verify the success of antibody-barcode conjugation, stain the tissue of interest with 6-9 conjugated antibodies. Run the multiplex imaging device and note each antibody concentration and exposure time. Adjust the dilutions and exposure times as needed, then run 6-9 new antibodies with the ones previously verified and note any adjustments. Follow the steps below for staining and imaging.
- Tissue staining and imaging
- The day before staining, bake the FFPE tissue slides in a 60 °C oven overnight. The next day, cool down the slides for 10 min at RT before starting the deparaffinization and tissue rehydration steps.
- Start deparaffinization of tissue by incubating in a xylene solution 2x for 5 min each.
- To rehydrate the tissue, move it through two rounds of 100% ethanol solution for 5 min each. Next, move it through a series of alcohol solutions from 90% to 70%, 50%, and 30% for 5 min each. Finally, wash the tissue with distilled water twice for 5 min each.
NOTE: Less toxic alternatives to xylene, such as a Neoclear solution, can be used for deparaffinization steps. Perform deparaffinization and rehydration under a fume hood. - Dilute 10x AR9 buffer to 1x using distilled water. Fill a Coplin jar with 50 mL of 1x AR9 buffer, making sure the slides are wholly immersed in the antigen retrieval buffer.
- Fill a pressure cooker with water so that the level is halfway up the Coplin jar, then incubate under high pressure setting for 20 min.
NOTE: It is possible to use a specialized pressure cooker or Decloaking Chamber for better antigen retrieval by setting it at 120 °C for 10 min. - After completing the pressure cooker step, cool down the slides for 45-60 min. Rinse the slide with distilled water 2x for 2 min each. Then, transfer the slide to the jar containing 1x PBS.
- To minimize autofluorescence, perform a bleaching step on the tissue before staining with antibodies. Freshly prepare a bleaching solution (25 mL of 1x PBS + 0.8 mL of 1M NaOH + 4.5 mL of H2O2) using the recommended reagents and concentrations. Incubate the slides in a plastic container containing the bleaching solution between two LED lamps for 45 min at room temperature. Repeat with fresh bleaching solution for another 45 min.
- Start preparing the antibody cocktail solution during this bleaching step, especially if there are several antibodies in the panel with various dilutions. Retrieve all four blockers (G, S, J, and N) and place them on ice, as some take time to thaw from -20 °C.
- After photobleaching, wash the tissue with 1x PBS, 2x for 2 min each. Move the tissue to jars containing hydration buffer and wash 2x for 2 min each.
- Transfer the tissue slides to the staining buffer and allow them to equilibrate for 30 min. If not prepared during the bleaching step, prepare the antibody cocktail solution during this time.
- Prepare 300 µL of antibody cocktail solution to stain two slides (usually, if using a hybridization plastic chamber, 100-120 µL of antibody cocktail is enough to stain each slide.)
- Stain the slides by applying an antibody cocktail solution inside the humidity chamber overnight at 4 °C.
NOTE: All antibodies here show a positive signal when stained overnight at 4 °C. However, each antibody's staining time and temperature may vary and must be optimized. The most commonly used staining conditions are 3 h at RT or overnight at 4 °C. If required, it is also possible to stain a few antibodies initially at different temperatures and then the remaining antibodies overnight at 4 °C. Wash tissue afterward with PBS if sequential staining is needed. - The next day, perform post-staining fixation. Remove the plastic chamber and store the collected antibody cocktail at 4 °C. Wash the slides 2x in the staining buffer for 2 min each. Next, move slides to a 40 mL post-staining fixing solution (4 mL of 16% Paraformaldehyde + 36 mL of storage buffer) and incubate for 10 min. Rinse with PBS 3x for 2 min each.
- Move slides into ice-cold methanol for 5 min, then rinse with PBS 3x for 2 min each. Apply a final fixative solution (20 µL one tube + 1 mL of PBS) to the slides under a humidity chamber. Usually, 200 µL of the fixative solution is enough per slide. Allow the fixative to sit for 20 min at RT. Perform three final washes in PBS for 2 min each.
NOTE: Do not remove the fixative tube from -20 °C beforehand; only thaw before applying. - If imaging immediately, wipe the slide around the tissue using a lint-free tissue and apply the flow cell by pressing it for 30 s using flow cell assembly equipment. If imaging later, store the slide (without applying the flow cell) in the storage buffer at 4 °C. When ready to image, transfer the slides from the storage buffer to PBS for 10 min before applying the flow cell.
- Start preparing running buffer 1x with additive based on desired cycles in the experiment. Prepare low (1:4) and high DMSO buffers (9:1) by mixing as 1-part DMSO with 4-parts running buffer and 9-part DMSO with 1-part running buffer required for the desired cycles. Save around 20 mL of 1x buffer with additive for making a reporter plate. To calculate the required 1x buffer with additive and high/low DMSO buffers, consult the instrument manager.
- Start preparing the reporter plate. First, make the reporter stock solution required for the total number of cycles. Label black or amber-colored 1 mL microcentrifuge tubes with cycle names. Add 250 µL of reporter stock solution and 5 µL of each reporter to the corresponding tube. Then, transfer the solution to a black 96-well plate and seal it with adhesive foil.
- Start the device, use the instrument manager to set the parameters and exposure times (as per Table 1), and acquire the images. Figure 1 summarizes the pre- and post-staining processes .
5. Tissue annotation and cell segmentation
- Set up a project and workspace.
- Install the latest version of digital pathology analysis software (e.g., QuPath version 0.5.1 or higher). Click on Create project to choose a destination folder for the project space.
- Click on Add images > Choose files, then navigate to the QPTIFF file (produced from multiplex immunofluorescence imaging). Set the image type to Fluorescence, keep all other default settings, and click Import.
- If using QuPath, double-click on the new image to open a workspace. Click File > Save periodically to keep track of changes made to the project. Toggle marker visibility and viewing settings using the Brightness & contrast (half-moon icon) near the middle of the toolbar.
NOTE: Right-click an image in the image list to rename it. This will be important later when visualizing phenotype classifications.
- Annotate full tissue section, intratumoral compartment, and stromal compartment.
- Use the brush and/or wand tool to draw an annotation around the entire tissue section. Define this annotation as Full_Tissue. Exclude overlying skin and/or any regions that should not be analyzed. To create a negative annotation and/or shrink the annotation boundary, hold the Alt key while using one of the annotation tools.
- Duplicate the full tissue annotation. Select the Annotation under the Annotations tab, then go to Objects > Annotations... > Duplicate selected annotations.
- Turn on the SOX10 channel. On the duplicated annotation, shrink the annotation boundary to capture the intratumoral compartment using the Alt + brush/wand tool. Define this annotation as a Tumor (Figure 2).
- Selecting the full tissue annotation, go to Objects > Annotations... > Expand annotations. Define Expansion radius as 1 μm and click Run.
- Rename the new annotation as Full_Tissue_Expansion. Select the Tumor Annotation, right-click, and select Insert in hierarchy.
- Re-select the Tumor Annotation, go to Objects > Annotations... > Make inverse. Define this new annotation as Stroma. Repeat for all tissue sections.
- Run cell segmentation and export results.
- Go to the Image tab to find the pixel width and height of the image (Figure 3A).
- Download the StarDist extension at https://github.com/qupath/qupath-extension-stardist/releases. Drag the qupath-extension-stardist-[version].jar file into the QuPath window, then click on the gear icon in the top right corner of the QuPath window. Under Extensions, define the QuPath user directory as the location of the StarDist folder.
- Download the StarDist groovy script files and the StarDist model file from https://github.com/xzhou125/JOVE_QuPath_Spatial_Analysis (StarDist scripts were originally organized from Akoya Biosciences).
- For each tissue section, select both the Tumor and Stroma annotations (use Ctrl to select multiple annotations). In the top settings bar, click on Automate > Script editor to open the scripts interface. Open the appropriate StarDist cell segmentation script (groovy file) that corresponds with the image pixel size. When prompted to select the cell segmentation file, open the stardist_cell_seg_model.pb file.
- After cell segmentation, save the image. Go to Measure > Export measurements, then select the Corresponding image(s). Assign the Export type as Cells and Separator as .csv, then choose the Output file location. Click on Populate beside Columns to include metrics of interest. Important columns to export are Image, Object ID, Parent, Centroid X, Centroid Y, and Nucleus Area.
NOTE: The Object ID is used in subsequent steps to remap classifications back to the multiplex immunofluorescence image in the digital pathology analysis software. The Parent column indicates the annotation name that the cell belongs to. X and Y data are used for spatial analysis. - For each lineage marker to be used in clustering/phenotyping, select one mean value to export. For nuclear markers (e.g., SOX10 and FOXP3), export the Nucleus: Mean option. For cytoplasmic/membranous markers (e.g., CD45, CD3, CD4), export the Cytoplasm: Mean option.
6. Proteomics data preprocessing and normalization
- Open the exported CSV file. For each marker to be used in clustering/phenotyping, truncate the name of the column heading to include only the marker. For example, rename SOX10: Nucleus: Mean to SOX10 and CD3: Cytoplasm: Mean to CD3.
- Install the latest version of R and RStudio. Download the Marker Normalization.R file from https://github.com/xzhou125/JOVE_QuPath_Spatial_Analysis and run the script. This first involves filtering out cells by nuclear size.
- For each marker, a min-max normalization is then performed so that the lowest MFI value in the range of expression is set to 0 and the MFI value at the 99.7th percentile is set to 1. All intensities above the 99.7th percentile are clipped at 1. Once complete, save the new CSV file generated with the normalized data.
7. Clustering and phenotyping
- Choose an algorithm for clustering cells according to marker expression profiles. At https://github.com/xzhou125/JOVE_QuPath_Spatial_Analysis, R scripts are provided for clustering using Seurat v4.415 and FlowSOM v2.13.9 (clustering and visualization tool)16.
- Phenotype cells according to the marker expression profiles of key lineage markers. The protocol presented here used 14 lineage markers for clustering and phenotyping: SOX10, CD45, CD3, CD4, CD8, FOXP3, CD11C, F4/80, CD68, CD86, CD163, CD206, NK1.1, and CD31.
- Define tumor cells as SOX10hi. Define CD4 T cells as CD45mod-hi/ CD4hi/CD8low/FOXP3low. Define CD8 T cells as CD45mod-hi/ CD8hi/CD4low. Define Tregs as CD45mod-hi/CD4hi/CD8low/FOXP3hi. Define other T cells as CD45mod-hi/CD3hi/CD4low/CD8low.
- Define M1 macrophages as CD45mod-hi/F4/80hi/CD68hi/CD86hi/CD163low /CD206low. Define M2 macrophages as CD45mod-hi/F4/80hi/CD68mod-hi/CD86low/CD163hi/CD206low, CD45mod-hi/F4/80hi/CD68mod-hi/CD86low/CD163low/CD206hi, or CD45mod-hi/F4/80hi/CD68mod-hi/CD86low/CD163hi/CD206hi. Define other macrophages as CD45mod-hi/F4/80hi/CD68mod-hi/CD86low/ CD163low/CD206low or CD45mod-hi/F4/80hi/CD68mod-hi/CD86hi/CD163hi/CD206hi.
- Define dendritic cells as CD45mod-hi/CD11chi/CD86mod-hi. Define NK cells as CD45mod-hi/NK1.1hi. Define other immune cells as CD45mod-hi that did not satisfy the conditions detailed above. Define endothelial cells as CD31mod-hi. Remove all other expression profiles.
8. Remapping phenotype classifications and performing quality control
- Download the Remapping Classifications.groovy script from https://github.com/xzhou125/JOVE_QuPath_Spatial_Analysis (this script was adapted from a post on https://forum.image.sc/ by petebankhead).
- Open the phenotyped CSV file and ensure that all labels under the Image tab exactly match the name of the image file in the digital pathology analysis software that will be used for remapping. To change large quantities of labels quickly in the CSV file, use the Replace All function.
- If using QuPath, run the classifications remapping groovy file by clicking Automate > Script editor.
- On the Annotations tab, click on the Three Dots beside the Auto set button, then click Populate from existing objects > All classes (including subclasses) > Yes.
- Scroll down in the marker list to view the different phenotype classifications and adjust the color scheme as needed. Double-click on any cell to view its phenotype (beside the Classification tag) and cluster (beside the Name tag). Check representative fields of view to determine the accuracy of phenotype assignments and revise the phenotyping strategy as needed (Figure 3B).
9. Density quantification and spatial analysis
- Once phenotyping is finalized, obtain annotation areas in the digital pathology analysis software under the Annotations tab. Convert area values to mm2, then divide counts by annotation areas to calculate densities.
- Download the SPIAT Spatial Analysis.R script from https://github.com/xzhou125/JOVE_QuPath_Spatial_Analysis and run. Collect data on average minimum distances (AMD), neighborhood compositions, and normalized mixing scores (NMS).
- Generate figures in statistical analysis software to present findings. When generating a single heatmap for average minimum distances of treatment conditions, average the results obtained from different tissue sections.
Results
Here, we present a protocol for designing an antibody panel for murine FFPE tissue, performing multiplex immunofluorescence imaging, and analyzing images for proteomics quantification and spatial relationships. The validated panel contains 27 antibodies that provide markers for visualizing melanoma cells (SOX10), leukocytes (CD45), T cells (CD3, CD4, CD8, FOXP3), B cells (CD20), macrophages and subtypes (F4/80, CD68, CD86, CD163, CD206), dendritic cells (CD11c), NK cells (NK1.1), and endothelial cells (CD31). The full panel also contains markers for other immune populations (CD11b, CD38), proliferation activity (Ki67), T cell functionality (T-bet, Eomesodermin, granzyme B), antigen presentation (LMP2, beta-2 microglobulin, MHC II), and checkpoint expression (TIM3, LAG3, PD-L1)12. A representative gel electrophoresis image confirms the successful conjugation of DNA oligonucleotide barcodes to the carrier-free antibodies, as shown in Figure 4. This step only confirms the chemical reaction, and image confirmation can only be done after checking these antibodies with the multiplex imaging device on the tissue of interest. See the following reference to view validated images of all 27 markers in the panel13. A fusion image of key lineage markers staining three murine melanoma tissue sections treated with intratumoral 4-1BBL/IL-12 nanoparticle injections and systemic anti-PD1 is presented in Figure 5. These sections were used for subsequent image analysis in this protocol.
After tissue annotation, cell segmentation, and proteomics data pre-processing, we present a comparison between two clustering algorithms that have previously been applied for single-cell transcriptomic and/or proteomic analysis17,18. Expression profiles for phenotyped populations are presented in Figure 6 for both approaches. We show that FlowSOM offers a wider range of intensity values (~0.7 vs ~0.5) for discerning differences between similar cell populations, such as macrophage subtypes. Seurat applied the Louvain algorithm during clustering and generated 29 clusters (Supplementary Figure 1). In comparison, FlowSOM applied self-organizing maps and can generate 100 clusters (Supplementary Figure 2). A larger number of clusters translates to more time required for phenotyping, but this latter FlowSOM approach also offers more nuance when classifying similar cell populations. Qualitatively, we see that FlowSOM was able to classify more intratumoral macrophages as either an M1 or M2 subtype when compared to Seurat phenotyping in the same field of view (Figure 7). The same result is seen when we quantify macrophage densities, with FlowSOM capturing a higher density of both M1 and M2 macrophages in comparison to Seurat (Figure 8A-B) and subsequently a significantly lower density of other/unclassified macrophages (p = 0.0028; Figure 8C). Nevertheless, the two analysis approaches also generated similar results when describing other cell population densities, such as CD4 T cells, CD8 T cells, and endothelial cells (Figure 8D-F).
We also present the downstream spatial analysis findings after clustering and phenotyping. Figure 9 demonstrates some of the spatial metrics that can be generated using this protocol. Relative to all phenotyped populations, M2 macrophages and NK cells had the highest AMDs following treatment with 4-1BBL/IL-12 nanoparticles and anti-PD1 (Figure 9A). Similarly, NMS between intratumoral CD8 T cells and M1 macrophages was much higher than between CD8 T cells and M2 macrophages (Figure 9B). Furthermore, M2 macrophages contributed ~1% in the 100 μm neighborhood surrounding intratumoral CD8 T cells, whereas M1 macrophages made up 9%-13% of these neighborhoods (Figure 9C). Taken together, these results suggest that the 4-1BBL/IL-12 treatment regimen polarized tumor-associated macrophages towards an M1 subtype and excluded M2 macrophages from the tumor immune microenvironment.
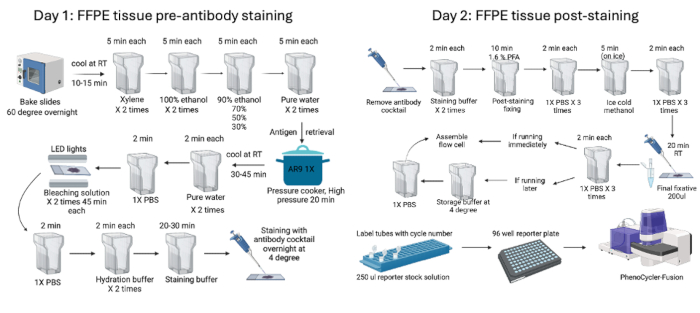
Figure 1: Summary of the FFPE tissue staining and imaging workflow. Murine FFPE tissues were processed using pre-staining procedures that started with baking the tissue overnight before starting the two-day pre-staining (day 1) and post-staining (day 2) processes. Finally, the reporter plate was prepared before imaging with the device. Please click here to view a larger version of this figure.
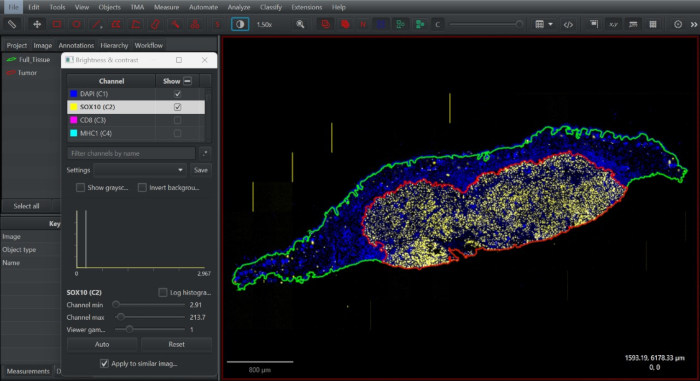
Figure 2: Screenshot of tissue annotation in open-access digital pathology software QuPath. Full tissue annotation was drawn (green), duplicated, and minimized down to define the intratumoral compartment according to the distribution of SOX10+ melanocytes at the tumor boundary (red). Please click here to view a larger version of this figure.
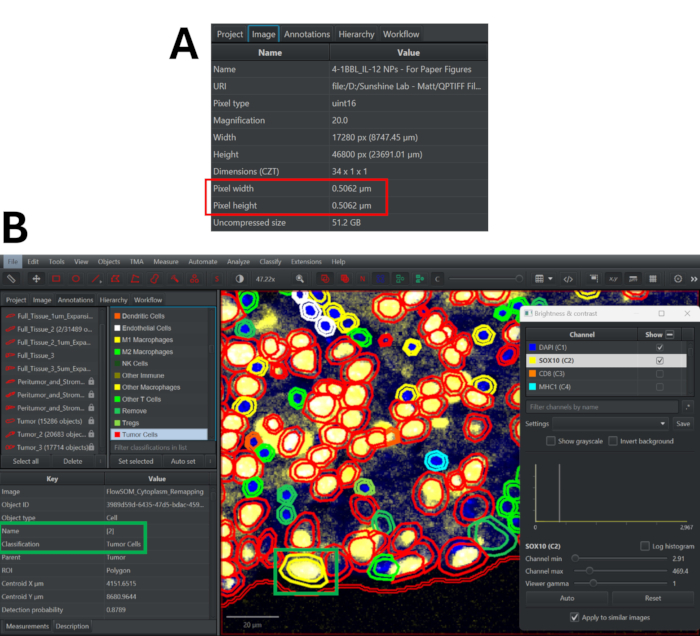
Figure 3: Cell segmentation using StarDist algorithm in QuPath and quality control process for reviewing phenotype classifications. (A) Navigate to the Image tab to determine the pixel width and height of the multiplex immunofluorescence image. (B) After remapping classifications, double click on any cell (becomes highlighted in yellow) to see its cluster assignment and phenotype. Toggle on/off panel markers to determine if this classification approach is accurate. Please click here to view a larger version of this figure.
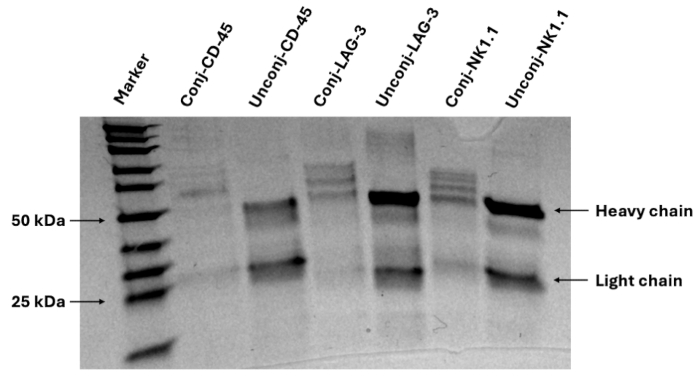
Figure 4: Representative gel image of antibody-DNA barcode conjugation confirmation. Protein gel electrophoresis confirms antibody conjugation with DNA oligonucleotide barcodes, observed by additional bands at the heavy chain site. Please click here to view a larger version of this figure.
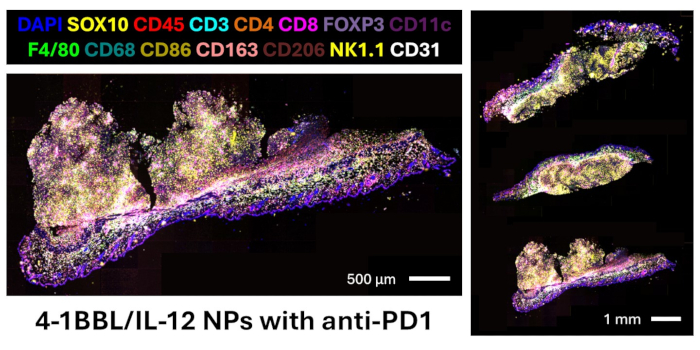
Figure 5: DNA-barcode-based multiplex imaging of B16F10 flank tumors treated with intratumoral injections of 4-1BBL/IL-12 nanoparticles with systemic anti-PD1. Markers in our panel not shown:CD11b, CD20, CD38, TIM3, LAG3, T-bet, Eomesodermin, granzyme B, Ki67, LMP2, beta-2 microglobulin, MHC II, PD-L1. Please click here to view a larger version of this figure.
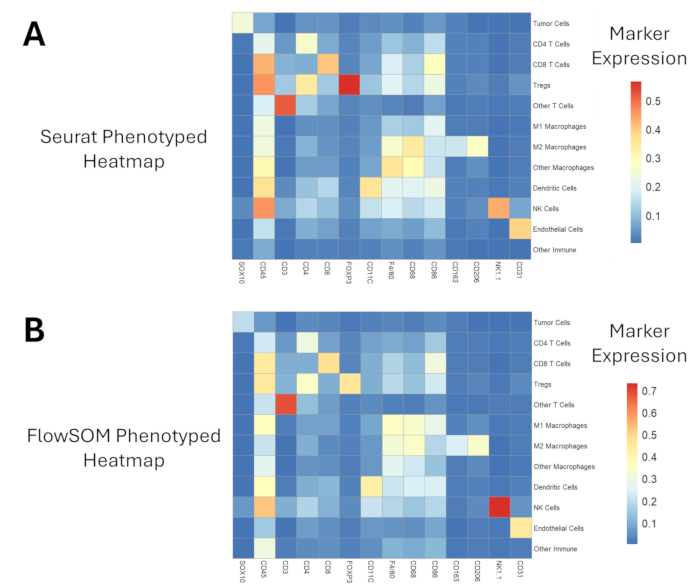
Figure 6: Proteomics expression heatmaps of phenotyped cell populations. (A) Seurat clustering and phenotyping approach generates a slightly smaller range of marker expression values compared to (B) FlowSOM clustering and phenotyping. Please click here to view a larger version of this figure.
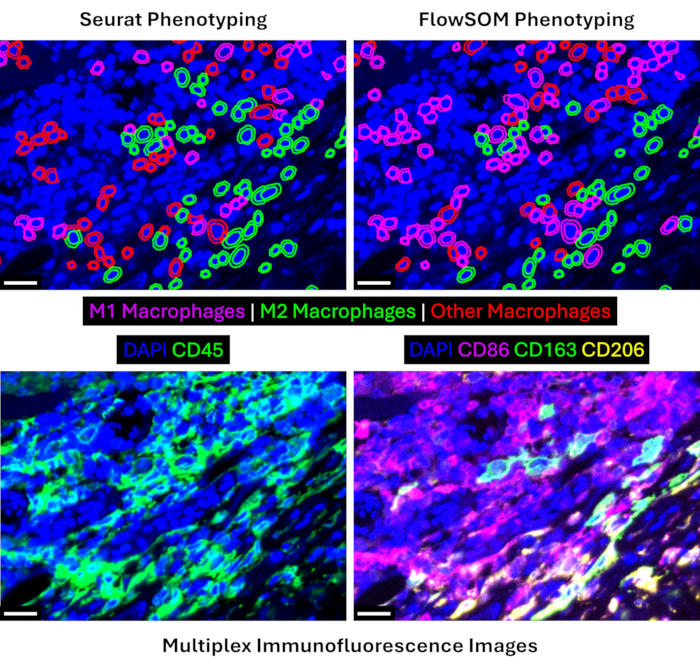
Figure 7: FlowSOM phenotyping identifies a greater range of different macrophage subtypes. Top panel shows Seurat (left) and FlowSOM (right) macrophage phenotyping for the same field of view. Bottom panel shows multiplex immunofluorescence images of key macrophage lineage markers in the same field of view. All scale bars are 20 μm. Please click here to view a larger version of this figure.
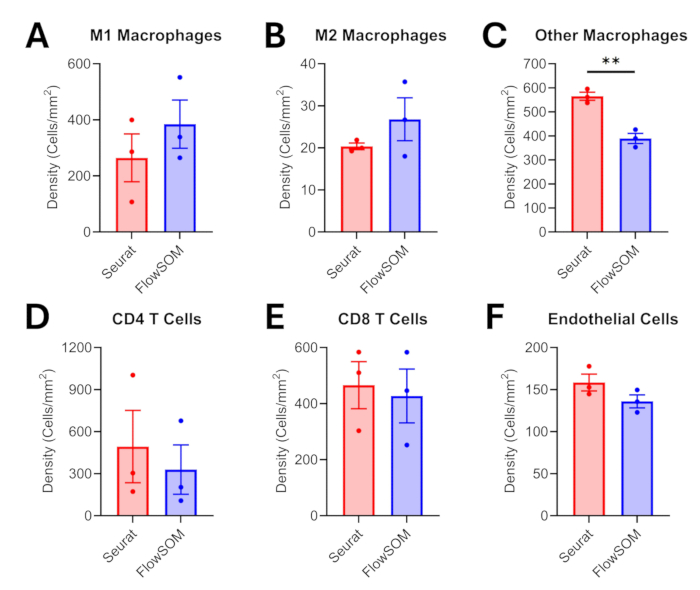
Figure 8: Comparing intratumoral densities of different cell populations after clustering/phenotyping. Density comparisons are shown for intratumoral (A) M1 macrophages, (B) M2 macrophages, (C) other macrophages, (D) CD4 T cells, (E) CD8 T cells, and (F) endothelial cells. Error bars are standard errors of the mean (SEM), and significance was tested using unpaired t-tests (**p ≤ 0.01). Please click here to view a larger version of this figure.
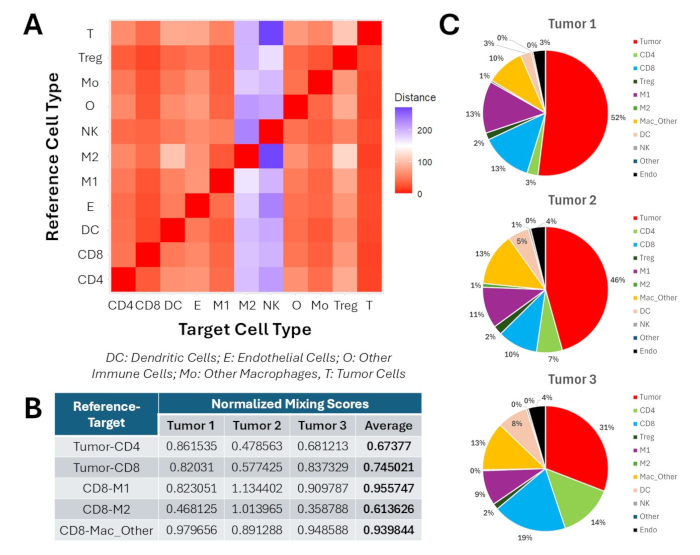
Figure 9: Profiling intratumoral spatial metrics for three flank tumors treated with 4-1BBL/IL-12 intratumoral nanoparticle injections and systemic anti-PD1. (A) Heatmap of average minimum distances between intratumoral phenotyped populations. Measurements are in μm. (B) Normalized mixing scores between key intratumoral phenotype pairs. (C) Breakdown of neighborhood compositions in a 100 μm radius around intratumoral CD8 T cell populations. Please click here to view a larger version of this figure.
| Antibody | Dilution | Exposure time (ms) |
| SOX-10 | 50 | 450 |
| CD8 | 100 | 450 |
| CD3 | 100 | 450 |
| FoxP3 | 50 | 350 |
| CD4 | 50 | 450 |
| MHC-II | 100 | 450 |
| PDL1 | 50 | 450 |
| CD45 | 100 | 450 |
| Ki-67 | 100 | 300 |
| F4/80 | 100 | 150 |
| CD20 | 100 | 450 |
| NK1.1/CD161 | 50 | 450 |
| CD206 | 100 | 450 |
| CD68 | 100 | 450 |
| Granzyme-B | 50 | 450 |
| CD86 | 100 | 150 |
| CD31 | 100 | 450 |
| CD11C | 50 | 450 |
| CD11b | 50 | 450 |
| EOMES | 50 | 450 |
| TIM-3 | 50 | 300 |
| CD38 | 50 | 200 |
| LAG3 | 50 | 450 |
| CD163 | 50 | 200 |
| T-bet | 50 | 300 |
| LMP2 | 100 | 100 |
| Beta2 MG | 200 | 50 |
Table 1: Antibody dilution and exposure time settings.
Supplementary Figure 1: Initial proteomics expression heatmap generated after Seurat clustering. Please click here to download this figure.
Supplementary Figure 2: Initial proteomics expression heatmap generated after FlowSOM clustering. Please click here to download this figure.
Discussion
The success of imaging depends on a well-designed and validated antibody panel. Multiplex immunofluorescence imaging of FFPE samples presents challenges due to high autofluorescence and the difficulty of retrieving epitopes masked by paraffin embedding. However, given that FFPE offers several advantages compared to FF specimens, it is essential to design and validate FFPE antibody panels. Finalizing the antibody clones that show positive signals during immunofluorescence (IF) imaging is the first step; subsequently, it is important to carefully conjugate them with DNA barcodes. Antibody conjugation requires partial reduction of the antibody to create SH bonds, which are utilized during the maleimide group reaction with a barcode. Not every antibody clone can withstand this step, and some reactions can cause irreversible damage to the antibody, resulting in imaging failure despite successful conjugation. For this reason, even though some antibodies may show positive signals during conventional IF validation, to assess the final success of the antibody conjugation, it is important to validate each antibody on the actual tissue of interest and record the desired exposure times for that tissue. In future applications, this technique can be combined with existing spatial transcriptomics analysis on consecutive slides/the same slide to generate additional insights. One of the limitations of this method is that it requires careful selection and validation of each antibody in the panel based on the target and the type of tissue.
With regards to image analysis, QuPath offers a valuable open-access tool with high-quality visualization of proteomics markers, wide functionality for exporting intensity measurements and performing quality control for phenotype classifications, and good flexibility for user-generated scripts. Online forums such as https://forum.image.sc/ are an additional resource for discussing how to accomplish specific analysis tasks and for sharing scripts with other users. In this protocol, we compare two clustering and phenotyping approaches using Seurat and FlowSOM. While FlowSOM may be preferred for its ability to generate more granular insights into immune cell subpopulations of the TME, the time required for proteomics analysis must also be taken into consideration. Generating 100 clusters may be unnecessary if a user only needs to phenotype cells within one or two tissue samples. In these situations, Seurat may offer a faster and more efficient pipeline for image analysis. In contrast, analyzing a TMA with upwards of 40 or 50 tissue sections is more likely to produce a larger number of cell clusters in both analysis approaches, and FlowSOM may be the preferred methodology for generating more nuanced phenotype classifications.
Cell clustering/phenotyping and all subsequent image analysis steps are largely dependent on cell segmentation. Our current work has explored cell segmentation in HALO (Indica Labs) and StarDist algorithms, and we have found that both approaches tend to over-segment cells based on nuclear DAPI signals. Many alternative segmentation algorithms are also available, such as Mesmer19 and InstanSeg20. This is a growing field of computational research that requires further exploration and optimization.
Disclosures
J.C.S. acknowledges financial support from Emerson Collective LLC and the National Institutes of Health. J.J.G. also acknowledges funding from the National Institutes of Health. J.C.S. has a relationship with Palleon Pharmaceuticals Inc., which involves funding grants. S.Y.T. and J.J.G. have a relationship with OncoSwitch Therapeutics that involves equity or stocks. S.Y.T., J.J.G., J.C.S., and K.M.L. have a pending patent. All other authors state that they have no known competing financial interests or personal relationships that could be perceived as influencing the research presented in this paper.
Acknowledgements
J.C.S. acknowledges the Dermatology Foundation and the Dermatopathology Career Development Award for advancing the Author's career. The authors thank Hsin-Pei Lee at the National Cancer Institute's Cancer Data Science Laboratory for assistance with computational analysis techniques. This research received funding from the Emerson Collective and the National Institutes of Health (R37CA246699, P41EB028239, and R01CA228133). Additionally, the Johns Hopkins Oncology Tissue Services (OTS) core is supported by the National Institutes of Health (P30CA006973).
Materials
| Name | Company | Catalog Number | Comments |
| 16% paraformaldehyde (PFA) | Electron Microscopy Sciences | PN# 15710 | Required during tissue staining process |
| 50kDa MWCO filter | Millipore | UFC505096 | 25 kDa and 100 kDa result in failure |
| Akoya barcodes and reporters | Akoya Biosciences | Varied | Each barcode can be used to conjugate 50 ug of carrier free antibody and comes with two vials of reporters |
| Antibody conjugation kit | Akoya Biosciences | 7000009 | A conjugation kit is used to create custom barcode-conjugated antibodies. Each kit contains sufficient reagents for ten conjugations. The kit consists of one subkit box stored at 4 °C and one subkit box stored at -20 °C. The 4 °C subkit includes Filter Blocking Solution, Reduction Solution 2, Conjugation Solution, Purification Solution, and Antibody Storage Solution. The -20 °C subkit includes Reduction Solution 1. |
| Beta2MG | Abcam | ab214769 | |
| CD11b | CST | #41028 | |
| CD11C | CST | #39143SF | |
| CD163 | CST | #68922BF | |
| CD20 | CST | #45839 | |
| CD206 | CST | #87887 | |
| CD3 | CST | #24581 | |
| CD31 | CST | #92841 | |
| CD38 | CST | #68336BF | |
| CD4 | Abcam | ab271945 | |
| CD45 | CST | #98819 | |
| CD68 | CST | #29176 | |
| CD8 | Invitrogen | #14-0808-82 | |
| CD86 | CST | #20018 | |
| Dimethyl sulfoxide | Avantor/VWR | BDH1115-4LP | |
| EOMES | Abcam | ab222226 | |
| Eppendorf PCR tubes | Eppendorf | E0030124286 | Required store 5 μL conjugated antibody for conjugation confirmation by gel electrophoresis |
| Ethanol 200 proof | |||
| F4/80 | CST | # 25514 | |
| FoxP3 | CST | #72338 | |
| Gran-B | CST | #79903SF | |
| Heating oven | |||
| Hybridization chamber | Used to stain tissue with antibody cocktail | ||
| Hydrogen peroxide | Sigma | #216763 | Required for preparing bleaching solution |
| Instant pot pressure cooker or Decloaking Chamber ARC | Instant pot or Biocare Medical | ||
| Ki-67 | Akoya Biosciences | ||
| LAG3 | CST | #80282BF | |
| LMP2 | Abcam | ab243556 | |
| Methanol | |||
| MHC-II | eBioscience | #14-5321-82 | |
| NK1.1 | CST | #24395SF | |
| Nuclear Stain | Akoya Biosciences | 7000003 | |
| PDL1 | CST | #85095 | |
| Salmon Sperm DNA, sheared (10 mg/mL) | Invitrogen | AM9680 | Can be used as an alternative to assay reagent (Akoya) during reporter plate preparation step. |
| SOX-10 | Abcam | ab245760 | |
| Staining kit for PhenoCycler-Fusion | Akoya Biosciences | 7000017 | The PhenoCycler-Fusion Sample Kit includes the buffers and reagents necessary for tissue staining using antibodies conjugated with PhenoCycler barcodes, along with flow cells for whole-slide imaging. Each kit is sufficient for 10 PhenoCycler-Fusion experiments. It consists of one subkit stored at 4 °C, another at -20 °C, and a package of 10 flow cells kept at room temperature. The subkit stored at 4 °C contains Hydration Buffer, Staining Buffer, Storage Buffer, N Blocker, and J Blocker. The subkit stored at -20 °C contains G Blocker, S Blocker, and Fixative Reagent. |
| T-bet | CST | #53753 | |
| TIM-3 | CST | #72911 | |
| UltraPure DNase/RNase-free distilled water | Invitrogen | 10977015 | Required to dissolve barcodes during antibody conjugation |
References
- Schadendorf, D., et al. Melanoma. Lancet. 392 (10151), 971-984 (2018).
- Taube, J. M., et al. Implications of the tumor immune microenvironment for staging and therapeutics. Modern Pathol. 31 (2), 214-234 (2018).
- Marzagalli, M., Ebelt, N. D., Manuel, E. R. Seminars in cancer biology. 59, 236-250 (2019).
- De Visser, K. E., Joyce, J. A. The evolving tumor microenvironment: From cancer initiation to metastatic outgrowth. Cancer cell. 41 (3), 374-403 (2023).
- Balkwill, F. R., Capasso, M., Hagemann, T. The tumor microenvironment at a glance. J Cell Sci. 125 (23), 5591-5596 (2012).
- Phillips, D., et al. Highly multiplexed phenotyping of immunoregulatory proteins in the tumor microenvironment by codex tissue imaging. Front Immunol. 12, 687673(2021).
- Giesen, C., et al. Highly multiplexed imaging of tumor tissues with subcellular resolution by mass cytometry. Nat Methods. 11 (4), 417-422 (2014).
- Keren, L., et al. Mibi-tof: A multiplexed imaging platform relates cellular phenotypes and tissue structure. Sci Adv. 5 (10), eaax5851(2019).
- Lin, J. R., Fallahi-Sichani, M., Sorger, P. K. Highly multiplexed imaging of single cells using a high-throughput cyclic immunofluorescence method. Nat Comm. 6 (1), 8390(2015).
- Radtke, A. J., et al. Ibex: An iterative immunolabeling and chemical bleaching method for high-content imaging of diverse tissues. Nat Protoc. 17 (2), 378-401 (2022).
- Black, S., et al. Codex multiplexed tissue imaging with DNA-conjugated antibodies. Nat Protoc. 16 (8), 3802-3835 (2021).
- Aung, T. N., Bates, K. M., Rimm, D. L. High-plex assessment of biomarkers in tumors. Mod Pathol. 37 (3), 100425(2024).
- Surwase, S. S., et al. Highly-multiplexed immunofluorescence phenocycler panel for murine ffpe yields insight into tumor microenvironment immunoengineering. Lab Invest. 105 (1), 102165(2024).
- Luly, K. M., Green, J. J., Sunshine, J. C., Tzeng, S. Y. Biomaterial-mediated genetic reprogramming of merkel cell carcinoma and melanoma leads to targeted cancer cell killing in vitro and in vivo. ACS Biomater Sci Eng. 9 (11), 6438-6450 (2023).
- Satija, R., Farrell, J. A., Gennert, D., Schier, A. F., Regev, A. Spatial reconstruction of single-cell gene expression data. Nat Biotechnol. 33 (5), 495-502 (2015).
- Van Gassen, S., et al. Flowsom: Using self-organizing maps for visualization and interpretation of cytometry data. Cytometry Part A. 87 (7), 636-645 (2015).
- Butler, A., Hoffman, P., Smibert, P., Papalexi, E., Satija, R. Integrating single-cell transcriptomic data across different conditions, technologies, and species. Nat Biotechnol. 36 (5), 411-420 (2018).
- Watson, S. S., et al. Microenvironmental reorganization in brain tumors following radiotherapy and recurrence revealed by hyperplexed immunofluorescence imaging. Nat Comm. 15 (1), 3226(2024).
- Greenwald, N. F., et al. Whole-cell segmentation of tissue images with human-level performance using large-scale data annotation and deep learning. Nat Biotechnol. 40 (4), 555-565 (2022).
- Goldsborough, T., et al. Instanseg: An embedding-based instance segmentation algorithm optimized for accurate, efficient and portable cell segmentation. arXiv. , (2024).
Reprints and Permissions
Request permission to reuse the text or figures of this JoVE article
Request PermissionExplore More Articles
This article has been published
Video Coming Soon
Copyright © 2025 MyJoVE Corporation. All rights reserved