Method Article
Live-Cell Förster Resonance Energy Transfer Imaging of Metabolically Regulated Akt Activation Dynamics in HepG2 Cells
In This Article
Summary
Here, we present a protocol to quantify the spatiotemporal dynamics of Akt activation and phosphorylation in live HepG2 cells. Förster resonance energy transfer (FRET) imaging is a powerful tool that provides valuable insights into insulin signaling pathways and metabolic regulation in cancer cells.
Abstract
Metabolically regulated Akt activation is a critical node in the insulin signaling cascade and provides valuable insights into the relationship between diabetes and cancer. To precisely quantify Akt activity in HepG2 cells, we developed a robust, reproducible protocol utilizing Förster Resonance Energy Transfer (FRET) with genetically encoded Akt-specific biosensors. This protocol outlines detailed steps for cell culture, imaging dish preparation, and transfection of HepG2 cells to express FRET-based biosensors, alongside specific guidelines for laser scanning confocal microscope hardware and software configuration. The results demonstrated unique patterns of insulin signaling in HepG2 cells, which exhibit an irreversible switch characterized by constitutive Akt activation with a defined switch-on threshold but no switch-off threshold. In contrast, myotubes display a reversible switch. The persistent Akt activation in HepG2 cells suggests mechanisms underlying insulin resistance and metabolic dysregulation in hepatic cells, with broader implications for understanding the progression of metabolic disorders and cancer. This protocol offers a valuable framework for exploring Akt-related signaling pathways and cellular behaviors across various disease contexts.
Introduction
Diabetes mellitus poses a major global health challenge, characterized by insulin resistance and impaired glucose homeostasis1. A comprehensive understanding of insulin signaling pathways is crucial for elucidating the pathophysiology of this disease, as insulin plays a pivotal role in glucose metabolism, cell growth, and survival2. Numerous studies have demonstrated that insulin signaling significantly impacts various cancers, linking insulin resistance to tumor progression and poor patient outcomes3,4,5,6. HepG2 cells, a commonly used hepatocellular carcinoma cell line, serve as a valuable model for studying insulin resistance and the interplay between metabolic dysregulation and cancer development7. Traditionally, researchers have viewed insulin responses as graded; however, recent studies have revealed that individual cells can exhibit bistable responses, displaying salient transitions between unresponsiveness and full response occurring at specific insulin concentration thresholds8,9.
Förster resonance energy transfer (FRET) imaging is a powerful tool for studying the spatio-temporal distribution of biomolecules in living cells10. By extracting information from molecular dynamics, FRET provides insights into processes such as Akt activation in real time, making it an invaluable technique for studying living cells11,12. This imaging method has proven essential in studying cellular dynamics, particularly in metabolic diseases and cancer, where precise molecular interactions are crucial13. FRET also enables real-time monitoring of molecular interactions, shedding light on mechanisms such as insulin resistance and tumor progression14,15. FRET biosensors are crucial in cancer research for studying tumor microenvironments, drug resistance, and metabolic disorders16. FRET detection methods, such as sensitized emission (SE), acceptor bleaching (AB), fluorescence lifetime imaging microscopy (FLIM), and spectroscopy, each offer distinct advantages to quantify molecular interactions17. SE measures energy transfer between donor and acceptor fluorophores, resulting in a measurable shift in emission spectra that correlates with the proximity of interacting biomolecules18. AB uses selective photobleaching of the acceptor fluorophore and tracks changes in donor fluorescence, which allows researchers to assess interaction kinetics and distances19. FLIM evaluates fluorescence decay rates of the donor fluorophore, directly influenced by FRET efficiency, to provide precise nanoscale measurements of molecular interactions20.
Using FRET techniques, we recently demonstrated bistable insulin responses in C2C12-derived myotubes8,9,21,22,23,24. The distinct switch-on and switch-off thresholds for Akt activation, as we discovered, suggest that the graded whole-body insulin dose-response belies the complexity of the subcellular signaling cascade starting from insulin stimulus, which culminates in an all-or-none response at the single-cell level21,22,23,24. To test the presence of bistability in other cell types, we stimulated HepG2 cells with insulin and recorded their response using single-cell FRET imaging. We stimulated HepG2 cells with varying insulin concentrations and monitored Akt activity at the single-cell level using an Akt biosensor. The Akt biosensor comprises enhanced cyan fluorescent protein (ECFP)25 as the donor fluorophore and the brightest variant of yellow fluorescent protein (YPet)26 as the acceptor fluorophore, linked by an Eevee linker containing the peptide sequence SGRPRTTTFADSCKP. This peptide acts as a substrate for phosphorylated Akt (pAkt), optimized from human glycogen synthase kinase 3β (GSK3β). In its unphosphorylated state, the spatial separation between the donor and acceptor fluorophores exceeds the Förster radius, which inhibits energy transfer. Upon insulin stimulation, Akt phosphorylation occurs and leads to the phosphorylation of SGRPRTTTFADSCKP. This process induces a conformational change that brings the donor and acceptor within the Förster radius, enabling FRET27. As a result, the FRET signal intensity correlates with the amount of phosphorylated Akt molecules and allows real-time quantification of insulin-mediated cellular responses.
This protocol, initially developed to study insulin signaling in C2C12-derived myotubes, has been successfully applied to HepG2 cells and utilized across different hardware and software platforms, thus demonstrating its applicability, adaptability, and versatility. HepG2 cells exhibit constitutive Akt activity, which makes them an ideal in vitro model to study liver-specific insulin signaling and metabolic processes. The key features of the protocol are described step-by-step in the protocol section.
Protocol
An overview of the experimental steps involved in FRET live-cell imaging to monitor Akt phosphorylation in single HepG2 cells is shown in Figure 1.
1. Plasmid acquisition, propagation, and purification
NOTE: This section outlines the essential steps for acquiring, amplifying, and purifying the plasmid required for single-cell FRET analysis.
- Utilize the pEevee-iAkt-NES-YPet plasmid (Figure 2A).
NOTE: The plasmid was generously provided by Prof. Kazuhiro Aoki at the National Institute for Basic Biology (NIBB), Japan.Plasmid maps for the FRET biosensors used for Akt monitoring and their respective controls are depicted in Figure 2. The pEevee-iAkt-NES-ECFP (donor; Figure 2B) and pEevee-iAkt-NES-Ypet (acceptor; Figure 2C) plasmids are used as calibration controls during FRET experiments9.
NOTE: Figure 3 shows the composition and mechanism of the intramolecular FRET biosensor. - To propagate the plasmid, perform bacterial transformation using chemically competent E. coli cells (see Table of Materials). Plate the transformed cells onto Luria-Bertani (LB) agar containing 100 µg/mL ampicillin and incubate overnight at 37 °C. The next day, select an ampicillin-resistant colony and culture it in LB broth supplemented with 100 µg/mL ampicillin for plasmid amplification.
- To purify the plasmid DNA, use a commercially available plasmid DNA purification kit (see Table of Materials) to obtain high purity and yield. Assess DNA quality by measuring absorbance ratios (A260/A280 and A260/A230) using a spectrophotometer (see Table of Materials). Ratios between 1.8-2.0 and 2.0-2.2 are considered optimal. Verify plasmid integrity through agarose gel electrophoresis to ensure it is suitable for transfection.
2. Cell culture procedure
NOTE: Perform all cell culture procedures within a laminar flow hood to maintain a sterile environment and prevent contamination. HepG2 cell culture workflow is shown in Figure 4. Complete media for HepG2 cells consists of Minimum Essential Medium (MEM), 10% fetal bovine serum (FBS), 1% Non-Essential Amino Acids (NEAA), 1 mM Sodium Pyruvate, 2 mM L-glutamine supplement, 100 U/mL Penicillin-Streptomycin, and 2.5 µg/mL antibiotic-antimycotic solution (see Table of Materials, Table 1).
- Rapidly thaw frozen HepG2 cells by placing the vial in a 37 °C thermomixer or water bath until completely thawed.
- Transfer the thawed cells to a 15 mL conical tube containing 10 mL of complete growth medium (see Table of Materials).
NOTE: Pre-warm the complete growth medium to 37 °C before use to minimize thermal shock to the cells. - Centrifuge the tube at 200 x g for 5 min to pellet the cells.
- Carefully aspirate the supernatant using a wide-bore pipette tip to avoid disturbing the cell pellet.
- Resuspend the pellet in 10 mL of fresh complete growth medium.
- Transfer the cell suspension to a 75 cm² tissue culture flask.
- Incubate the flask at 37 °C in a humidified atmosphere with 5% CO2
NOTE: Observe the cells over the next 24-48 h to confirm attachment and assess recovery. Do not disturb the cells for at least 4 h to ensure proper attachment before changing the medium. Avoid opening the incubator frequently during the first 4 h, as this may disrupt cell attachment. Follow institutional biosafety protocols and use appropriate personal protective equipment (PPE) to maintain a safe working environment during all cell culture procedures. Subculture HepG2 cells when they reach 70%-80% confluence for maintaining optimal growth conditions and preventing overcrowding, which can impact cell viability and growth potential. - For subculturing, aspirate the medium and rinse the cells once with 5 mL of phosphate-buffered saline (PBS).
- Add 1 mL of 0.25% trypsin to cover the cell monolayer (see Table of Materials).
NOTE: Ensure the trypsin is pre-warmed to 37 °C for optimal activity. Do not over-trypsinize the cells, as this may reduce viability. Monitor the cells under a microscope to confirm detachment. - Incubate at 37 °C for about 5 min.
- When the cells detach, add 2 mL of complete medium to neutralize the trypsin and collect the cells by pipetting.
- Gently pipette the cell suspension to break up clumps and achieve a single-cell suspension.
- Add 3 mL of complete medium to each new flask, then transfer the cells at a split ratio of 1:2 to each flask.
NOTE: For early passages, split the cells at a dilution of 1:2. After passages 4-5, dilutions of 1:4 or 1:5 may be performed as appropriate. - Incubate the cells at 37 °C in a humidified atmosphere with 5% CO2.
NOTE: Check the cells after 24 h to confirm attachment and assess recovery. - For routine culture, replace the culture medium every 2-3 days or sooner if the pH indicator changes from pink to yellow, indicating acidification.
NOTE: Do not let the medium become too acidic, as this may harm the cells. - Check cell morphology regularly under a microscope to ensure cell health.
NOTE: For short-term storage, freeze HepG2 cells at -80 °C; for long-term storage, store in liquid nitrogen. The composition of the freezing medium used in this experiment is outlined in (Table 2).
3. Coating imaging dishes with poly-l-lysine
- Use 1 mL of a 0.1 mg/mL Poly-L-Lysine solution per imaging dish to cover the entire surface (see Table of Materials).
NOTE: Adjust Poly-L-Lysine concentration based on specific cell type requirements. - Rock the dish gently to achieve a uniform coating of the culture surface.
NOTE: Ensure sterile conditions throughout the process to prevent contamination. - Incubate the dishes overnight at room temperature (RT).
- Aspirate excess Poly-L-Lysine solution from dishes by pipetting out.
- Rinse the surface with PBS three times, resting for 5 min each time (see Table of Materials). Completely remove the unbound Poly-L-Lysine from the imaging dish to prevent cell growth inhibition. Rinse plates gently to avoid scraping or damaging the glass bottom.
- Air dry the coated imaging dishes at 37 °C for at least 3 h.
- Use the coated imaging dishes immediately or store them at 4 °C for up to 2 weeks.
4. Transfection of HepG2 cells
NOTE: HepG2 transfection method is illustrated in Figure 5.
- Seed HepG2 cells in pre-coated imaging dishes 24-48 h prior to transfection to ensure they reach 70%-90% confluence.
- Thaw the transfection reagent and plasmid encoding the FRET biosensor on ice. Vortex thoroughly and perform a short spin (e.g., 5,000 x g for 5 s) before use (see Table of Materials).
NOTE: Ensure that the transfection reagent and plasmid are fully thawed before use.
CAUTION: Avoid repeated freeze-thaw cycles, as this may reduce the efficiency of the transfection reagent. - Add 8 µg of plasmid encoding the FRET biosensor with the reaction buffer to a final volume of 100 µL. Mix well by vortexing for 5 s at high speed (approximately 3,000-5,000 x g).
NOTE: Always add plasmid to the buffer before adding the polymer-based transfection reagent. At least 50 µL of the solution must consist of the reaction buffer (see Table of Materials). - Add 2.4 µL of the transfection polymer to the tube containing the diluted plasmid DNA. Mix well by vortexing for 15 s at high speed (approximately 3,000-5,000 × g).
NOTE: Always use 0.3 µL of the transfection polymer per 1 µg of DNA.
CAUTION: Ensure the transfection polymer is thoroughly mixed with the plasmid DNA to form uniform nanoparticle complexes. - Incubate the biosensor and polymer mixture at 37 °C for 15 min to allow nanoparticle complexes to form.
NOTE: Avoid keeping the transfection polymer in solution for over 30 min, as this may reduce transfection efficiency.
CAUTION: Monitor the incubation time carefully to prevent over-incubation, which may lead to reduced transfection efficiency. - Spin down the tube for 5 s at 5,000 x g to collect the contents at the bottom, then add the entire 100 µL of nanoparticle complex solution dropwise to the cell culture medium. Gently rock the plate back and forth to mix.
NOTE: Ensure the nanoparticle complex solution is added dropwise to distribute it evenly across the cell culture medium.
CAUTION: Avoid vigorous rocking, as this may dislodge cells or cause uneven distribution of the complexes. - Incubate the plate at 37 °C for 4 h to overnight.
NOTE: The incubation time can be adjusted based on experimental needs, but 4 h is typically sufficient for efficient transfection.
CAUTION: Avoid prolonged incubation (>16 h), as this may reduce cell viability. - Remove the nanoparticle complexes from the cells by aspiration, replace them with 2 mL of fresh complete growth medium, and return the plate to the 37 °C incubator until the time of analysis. Peak expression typically reaches 48 h post-transfection.
- Analyze the cells under fluorescence microscopy.
NOTE: Ensure the microscope is properly calibrated for fluorescence imaging to obtain accurate results.
CAUTION: Minimize exposure of cells to intense light during imaging to prevent phototoxicity.
5. Starvation of HepG2 cells
NOTE: After completing the transfection step, serum-starve the cells before insulin stimulation and FRET imaging. This minimizes Akt pathway activation due to insulin present in FBS and ensures consistent baseline levels of Akt activity. The composition of the starvation medium used in this experiment is described in (Table 3). BSA comes in powdered form. To prepare a 0.1% (w/v) solution, reconstitute 0.1 g of BSA in 3 mL of DMEM, mixing thoroughly. Sterilize the solution using a 0.45 µm filter and adjust the final volume to 100 mL by adding DMEM.
- Remove the culture medium and rinse the imaging dishes with 1x PBS twice for 5 min each.
NOTE: The two PBS washes help to completely remove residual serum and any insulin or growth factors that may interfere with the experiment. - Add 2 mL of starvation medium to the imaging dishes (see Table of Materials). Gently add the medium around the edge of the dish to avoid dislodging the cells from the glass bottom. Incubate at 37 °C for 4 h.
NOTE: The 4-h incubation is optimal for synchronizing cellular metabolism; however, the duration can be extended depending on experimental needs.
6. FRET live-cell imaging for HepG2 cells
NOTE: This section provides instructions for FRET live-cell imaging to monitor the spatiotemporal dynamics of Akt phosphorylation in single HepG2 cells. It is essential to optimize the microscope setup, handling procedures, and imaging conditions for live HepG2 cells, as detailed below. The microscope setup is crucial for optimizing imaging conditions for FRET imaging. Follow the PC/confocal laser scanning microscopy (CLSM) setup stepwise according to the manufacturer's instructions to ensure stable operation. The customized CLSM configuration for FRET imaging is shown in (Figure 6) .
- Turn on the remote switch to power the microscope, computer, scanner, laser launch, piezo stage, and epifluorescence LED light source. Ensure all components are properly connected before powering on to avoid any potential damage.
- Turn the key to the ON position on the laser launch and press the buttons to activate both lasers required for FRET (457 nm and 514 nm laser lines).
NOTE: Ensure that the appropriate filters and settings are in place for optimal FRET imaging. Laser line selection should be based on the biosensor's excitation and emission profiles. - Turn on the power strip to power the computer and monitor connected to the microscope.
NOTE: Ensure all connections are secure before powering on to prevent any equipment damage. - Log into Windows and launch the microscopy software.
- Click on A1 for Acquisition to initiate the imaging setup. Select the appropriate optical configurations based on the requirements of the FRET experiment.
- Adjust the laser power and detector sensitivity as needed for optimal imaging conditions. Carefully install the microscope stage top incubator and secure it with screws.
NOTE: Do not overtighten the screws to prevent damage to the incubator or the microscope stage. - Fill the internal water bath with sterile double-distilled water (ddH2O). Install the top heater securely and turn on the power supply for the stage heater, bath heater, and lens heater (Figure 7A).
NOTE: Do not overfill to avoid spillage into the system. Ensure all heaters are functioning properly to maintain consistent temperature conditions for live-cell imaging. - Use the 40x oil immersion lens for imaging (see Table of Materials).
NOTE: Refer to the manufacturer's website for technical specifications. - Wipe the objective lens with lens paper moistened with 95% ethanol. Place a small droplet of immersion oil on the objective lens (Figure 7B). Place the imaging dish containing the HepG2 cells on the microscope stage and secure it with the holder (Figure 7C).
NOTE: Ensure that the imaging dish is properly aligned and secured to prevent any movement during imaging. Avoid pressure against the lens to prevent damage to both the lens and the glass bottom of the dish. - Close the chamber and incubate the cells within the live cell chamber for 1-2 h to allow them to equilibrate (Figure 7D).
- During time-lapse imaging, pause at specific intervals and gently remove the media (Figure 7E), then add 1 mL of freshly prepared media with the given insulin concentration (Figure 7F, Table of Materials).
NOTE: Prepare a 1 mg/mL insulin stock solution by dissolving 1 mg of insulin in 1 mL of 10 mM acetic acid. Filter the solution through a 0.2 µm sterile syringe filter and store aliquots at −20 °C. - Launch the ND Acquisition window from the File menu of the microscopy software.
NOTE: ND Acquisition setup is shown in (Figure 8). - Select the Time tab to set the interval, duration, and desired loops for time-lapse imaging. Next, click the XY tab and press the + add button to include individual HepG2 cells for imaging.
- To add multiple cells, locate suitable cells, scan, fine-tune focus, and lock the Point Spread Function (PSF). Repeat this step for each new cell added for imaging. Scan multiple cells in different locations within the imaging dishes to identify various target cells for inclusion.
- Click the red X icon to deselect cells. Check the 'Z' box to set the Z position. After selecting all parameters, enter the experiment name in the 'File Name' box.
- Click Browse to choose the destination folder, then check the box save to file. Hit the Run now tab to initiate the ND acquisition. The ND acquisition window will show the real-time progress of the time-lapse imaging, including elapsed and remaining time.
- Record baseline measurements for up to 30 min without stimulating the cells with insulin.
- Locate suitable cells, zoom in/out to bring a single cell into focus, and select cells with high fluorescence intensity. Add the cells one by one, up to a maximum of 6 cells.
NOTE: Limit the number of cells to prevent delays in image acquisition and window freezing during imaging. - Set the time and imaging frequency for the time-lapse imaging. Start the time-lapse imaging.
NOTE: Ensure that all parameters, including exposure time and laser power, are optimized before beginning the imaging session. - Pause imaging at regular intervals, gently remove the media from the glass-bottom dish, and add 1 mL of medium supplemented with the appropriate insulin concentration.
- Resume the image acquisition. Repeat step 6.20 as required.
- At the end of the experiment, click the Finish tab to close. Back up and store acquired images securely for analysis.
7. Data analysis
- Correct the pre-processed time-lapse FRET imaging data from control samples for spectral crosstalk and CFP autofluorescence, which results in corrected FRET values and precise FRET efficiency. Use imaging software for the acquisition, processing, and analysis of FRET images, following protocols outlined in previous studies27,28,29,30 (Figure 9).
8. FRET efficiency calculations
- To determine FRET efficiency , acquire seven images: cell (IDA(D), IDD(D), IDA(A), IAA(A), IDD, IAA, and IDA). Calculate the FRET efficiency using the following formula:

where FRETCorrected is obtained from the equation:

with d and a defined as:


Here IDA, IDD, and IAA represent images of cells transfected with the biosensor. IDA(D) and IDD(D)) are donor-only control images, and IDA(A) and IAA(A) are acceptor-only control images.
9. Image acquisition
- IDA : Obtain the image by donor excitation (434 nm) with acceptor emission (530 nm).
- IDD : Obtain the image by donor excitation (434 nm) with donor emission (477 nm).
- IAA : Obtain the image by acceptor excitation (517 nm) with acceptor emission (530 nm).
- IDA(D) and IDA(A) : Acquire the image using the same excitation and emission as IDA but from cells expressing only the donor and acceptor, respectively.
- IDD(D) : Acquire the image under the same conditions as IDD for the donor-only control.
- IAA(A) : Obtain the image using the same conditions as IAA but is specific to the acceptor-only control.
10. Background correction
- Open the image analysis software on the computer. From the top menu bar, access the File menu. Select Open or Open File from the dropdown options.
- Navigate to the directory containing the time-lapse image data. Locate the time-lapse image that requires analysis (e.g., nd2 format).
- Choose the file and click Open or OK to load it into the software for viewing and analysis. Define a region of interest (ROI) within the cell (or use the entire cell as the ROI) and record the gray value of each pixel within this region.
- Choose a cell-free area as the background and calculate its average gray value. Create the corrected image by subtracting this background average from each pixel's gray value within the cell ROI.
11. FRET bleed-through (crosstalk) elimination
NOTE: The spectral overlap between the donor emission and acceptor excitation is depicted in Figure 3B, which is critical for the FRET efficiency and energy transfer process. Bleed-through in time-lapse FRET imaging is a significant challenge that arises from the spectral overlap of donor and acceptor fluorophores, leading to inaccurate measurements. Crosstalk is inherent because the spectra of both donor and acceptor fluorophores overlap to some extent (Figure 3C, D). This issue is exacerbated by factors such as high fluorophore concentrations and improper filter configurations. Addressing bleed-through is crucial for ensuring the reliability of FRET measurements.
- Refer to a previous study for a method to mitigate bleed-through effects9.
12. Quantification and statistical analysis
- Perform statistical analysis using statistical analysis software.
Results
To investigate Akt activation in HepG2 cells, the cells were seeded onto pre-coated imaging dishes and transfected with the FRET-based biosensor pEevee-iAkt-NES (Figure 2A), designed to enable real-time monitoring of Akt phosphorylation. Following transfection, the cells underwent serum starvation for 4 h in a serum-free medium to synchronize their metabolic state and minimize basal insulin signaling.
The cells were subsequently exposed to varying insulin concentrations (0 pM, 300 pM, 400 pM, 500 pM, 400 pM, 100 pM, and 0 pM) to systematically activate the insulin signaling pathway. As shown in Figure 10A, a dose-dependent increase in Akt phosphorylation was observed. Notably, a sharp increase in phosphorylation occurred at 300 pM insulin, marking the threshold for maximal Akt activation. Beyond this concentration, the phosphorylation levels plateaued, with a gradual increase observed up to 500 pM.
Interestingly, when insulin concentrations were sequentially reduced from 500 pM to 0 pM, Akt activation was sustained, with phosphorylation levels remaining elevated and failing to return to baseline. This phenomenon indicates constitutive Akt activation, suggesting that once the activation threshold at 300 pM insulin is exceeded, Akt phosphorylation remains active irrespective of subsequent reductions in insulin concentration.
The normalized data presented in Figure 10B,C were obtained from three independent experiments. In these experiments, in which cells were stimulated with sequentially increasing insulin concentrations (0 pM, 100 pM, 200 pM, 300 pM, 400 pM, and 500 pM), followed by a stepwise decrease (500 pM, 400 pM, 300 pM, 200 pM, 100 pM, and 0 pM). This experiment demonstrated a similar pattern of Akt activation, confirming the dose-dependent response and the sustained Akt activity beyond the activation threshold.
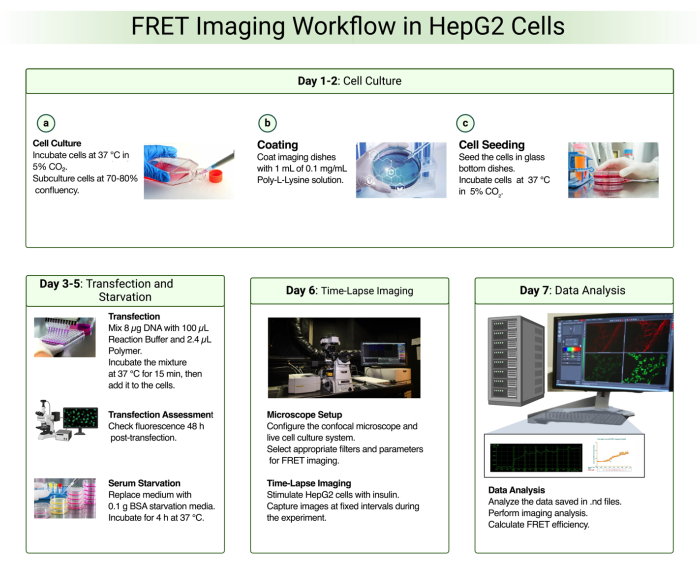
Figure 1: FRET Imaging workflow in HepG2 cells Please click here to view a larger version of this figure.

Figure 2: Plasmid maps of FRET biosensors for Akt monitoring. (A) pEevee-iAkt. (B) pEevee-iAkt-NES-ECFP (donor). (C) pEevee-iAkt-NES-YPet (acceptor). This figure has been adopted with permission from Akhtar et al.9. Please click here to view a larger version of this figure.
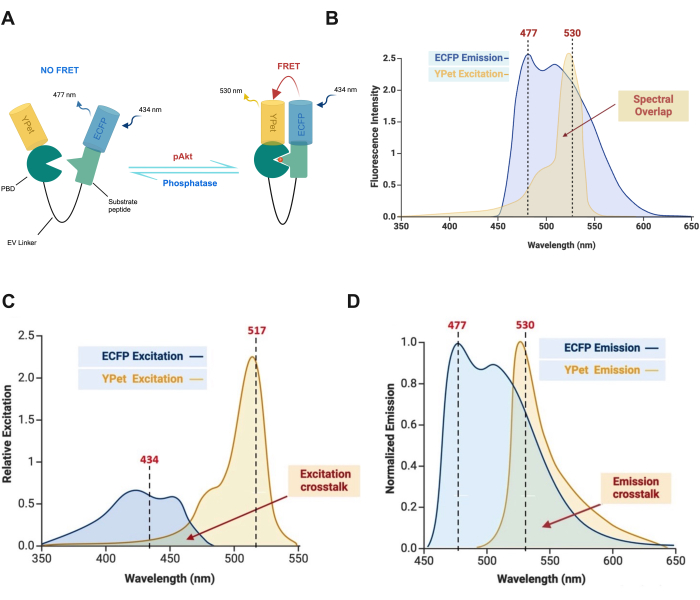
Figure 3: Composition and mechanism of the intramolecular FRET Biosensor. (A) Phospho-Akt phosphorylates the substrate peptide (SGRPRTTTFADSCKP), which promotes PBD binding and induces a conformational shift, allowing energy transfer from the donor fluorophore to the acceptor fluorophore27,31. (B) Spectral overlap between donor emission and acceptor excitation. (C) Excitation crosstalk arises due to the overlap between the excitation spectra of ECFP and YPet. (D) Emission crosstalk occurs because of the overlap between the emission spectra of ECFP and YPet. This figure has been adopted with permission from Akhtar et al.9. Please click here to view a larger version of this figure.
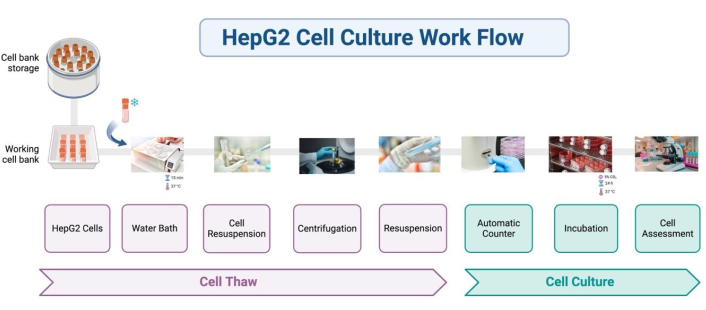
Figure 4: HepG2 cell culture workflow. Please click here to view a larger version of this figure.
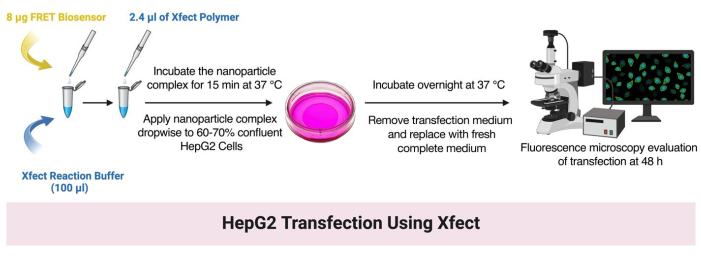
Figure 5: HepG2 transfection. Please click here to view a larger version of this figure.
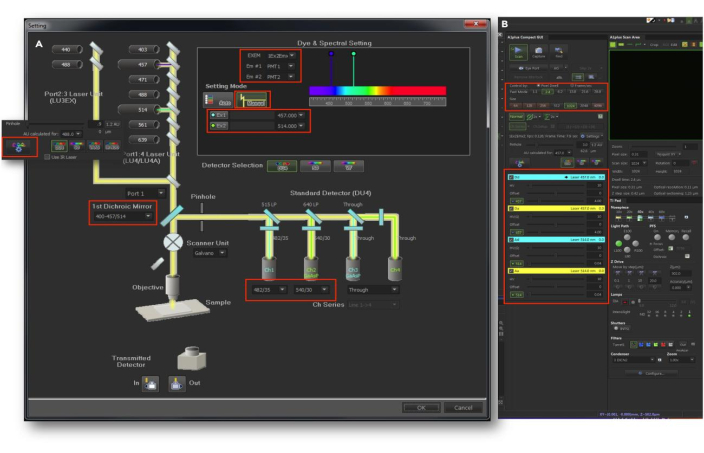
Figure 6: Customized CLSM configuration for FRET imaging. (A) Select the desired channels and configure the settings in the optical path panel. (B) In the Aplus settings panel, choose the appropriate channels, set the laser power and intensity, pixel dwell time, pinhole, and other relevant parameters. Keep the offset set to "0" as the default. This figure has been adopted with permission from Akhtar et al.9. Please click here to view a larger version of this figure.
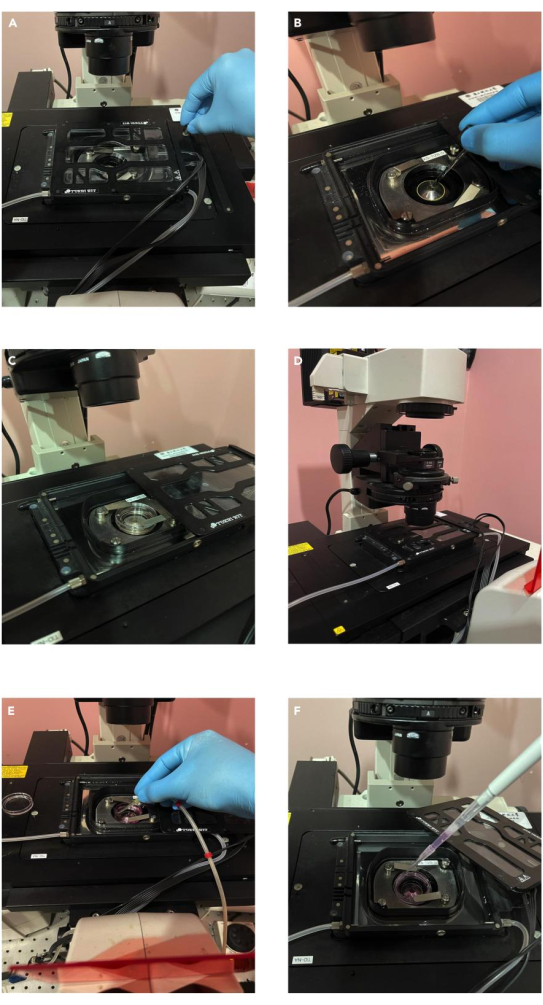
Figure 7: Microscope setup and sample preparation for Live-Cell Imaging. (A) Install the TOKAI HIT Stage Top Incubator to regulate temperature and CO2 levels. (B) Apply immersion oil to the 40× oil immersion lens. (C) Mount a 35 mm imaging dish with a glass bottom onto the temperature-controlled stage. (D) Pre-incubate samples in the live-cell chamber to equilibrate with environmental conditions. (E) Remove media using a precise peristaltic pump. (F) Add insulin-supplemented media to the dish using a fine pipette tip. This figure has been adopted with permission from Akhtar et al.9. Please click here to view a larger version of this figure.
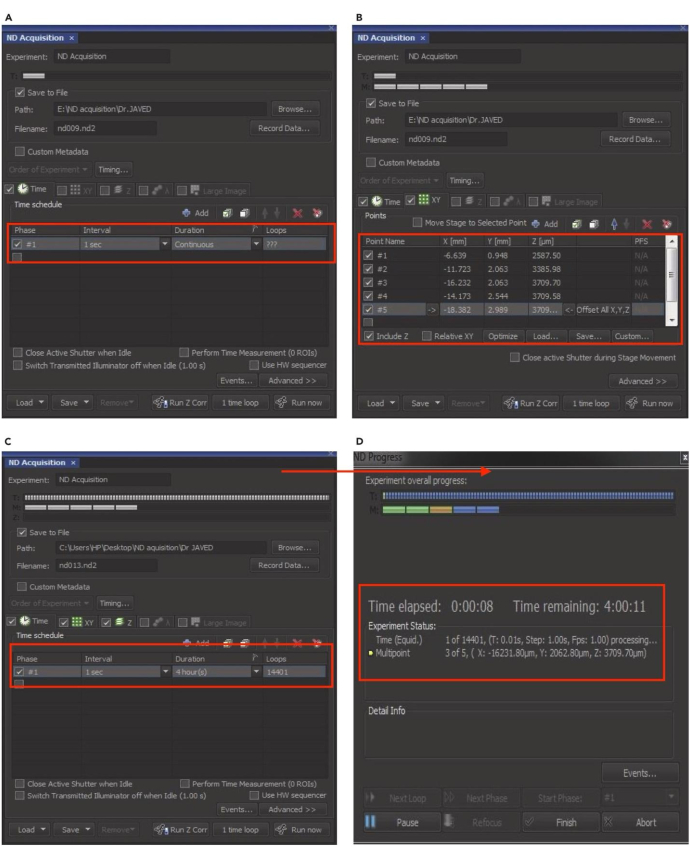
Figure 8: Setting up ND Acquisition for time-lapse Imaging. (A) In the ND Acquisition window, enable the time option to set the interval, duration, and number of loops for the time-lapse experiment. (B) Click on the XY option to select or deselect individual cells for imaging. (C) Enable the Z option to lock the Z position and click "Run" to resume the experiment. (D) The ND progress window will pop up and show the real-time status of the experiment. This figure has been adopted with permission from Akhtar et al.9. Please click here to view a larger version of this figure.
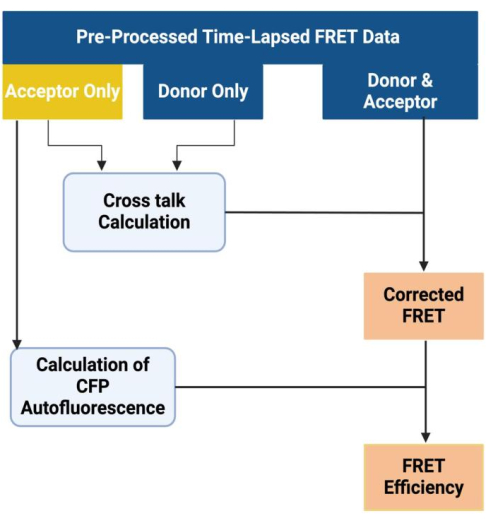
Figure 9: Workflow for FRET data analysis. This figure has been adopted with permission from Akhtar et al.9. Please click here to view a larger version of this figure.
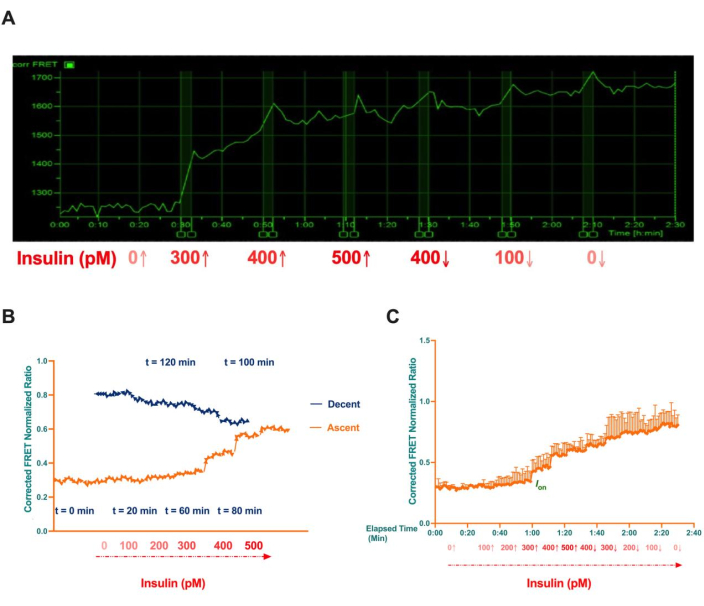
Figure 10: Representative time-lapse images and average normalized FRET signal ratio of Akt phosphorylation in single HepG2 cells. (A) HepG2 cells exhibited maximum FRET efficiency when stimulated with 300 pM insulin, which marked the threshold for maximal Akt activation. A gradual increase in FRET efficiency was observed as insulin concentrations rose to 500 pM. Even with a stepwise decrease in insulin concentration from 500 pM to 0 pM at various intervals, sustained Akt activation persisted, indicating constitutive Akt phosphorylation. (B) FRET signal plotted against insulin concentration, illustrating an irreversible switch-like response. (C) FRET signal plotted against elapsed time, with error bars indicating standard deviation. This figure has been adopted with permission from Akhtar et al.8. Please click here to view a larger version of this figure.
| Reagent | Amount (mL) | Final concentration |
| MEM (Minimum Essential Medium) | 85.9 | N/A |
| Fetal Bovine Serum (FBS) | 10 | 10% (v/v) |
| Non-Essential Amino Acids (NEAA) (100x) | 1 | 1x |
| GlutaMAX Supplement | 1 | 2 mM |
| Sodium Pyruvate (100 mM) | 1 | 1 mM |
| Penicillin-Streptomycin (10,000 U/mL) | 1 | 100 U/mL |
| Plasmocin Prophylactic (2.5 mg/mL) | 0.1 | 2.5 μg/mL |
| Total | 100 | N/A |
Table 1: MEM Complete media composition.
| Reagent | Amount (mL) | Final concentration |
| MEM (Minimum Essential Medium) | 6 | 60% (v/v) |
| Fetal Bovine Serum (FBS) | 3 | 30% (v/v) |
| DMSO | 1 | 10% (v/v) |
| Total | 10 | N/A |
Table 2: Composition of freezing medium.
| Reagent | Amount (mL) | Final concentration |
| MEM (Minimum Essential Medium) | 95.9 | N/A |
| Bovine Serum Albumin (BSA) | 0.1 g | 0.1% (w/v) |
| Non-Essential Amino Acids (NEAA) (100x) | 1 | 1x |
| GlutaMAX Supplement | 1 | 2 mM |
| Sodium Pyruvate (100 mM) | 1 | 1 mM |
| Penicillin-Streptomycin (10,000 U/mL) | 1 | 100 U/mL |
| Plasmocin Prophylactic (2.5 mg/mL) | 0.1 | 2.5 μg/mL |
| Total | 100 | N/A |
Table 3: Composition of Starvation Medium.
Discussion
The protocol for live-cell FRET imaging to monitor Akt phosphorylation in HepG2 cells involves several key steps to ensure reliable and reproducible results. The first critical step is cell culture, which includes routine cell maintenance, coating of imaging dishes, and cell seeding. Proper coating is essential for cell attachment during time-lapse imaging experiments, as it ensures stable cell adherence, prevents detachment, and minimizes drift, which can lead to inconsistent data9,32. Variations in cell thickness or subcellular structures may result in parts of the cell being out of focus, affecting measurement accuracy. Temperature, pH, and ion concentrations impact FRET signals and add variability33,34,35. Proper cell attachment supports cellular health, maintains signaling integrity, and ensures accurate FRET measurements. Transfection of HepG2 cells with the FRET-based Akt biosensor is a critical step, as transfection efficiency directly affects FRET signal intensity and consistency31. However, transient transfection inherently leads to heterogeneity in biosensor expression. This variability can be minimized by optimizing transfection conditions, implementing rigorous controls, and selecting cells with uniform fluorescence intensity. Ensuring homogeneous expression across the cell population is essential for obtaining consistent and reliable results. Sensitized emission (SE) calibration using control samples-such as donor-only, acceptor-only, and donor-acceptor constructs-is crucial for accurate quantification of FRET efficiency. This calibration corrects for spectral crosstalk and establishes consistent baseline measurements, enabling precise data interpretation28,36,37,38.
While the SE-FRET method provides valuable real-time insights into Akt phosphorylation dynamics, several limitations must be addressed to ensure accurate and reliable results. Spectral crosstalk between donor and acceptor fluorophores can distort FRET signals, necessitating the use of multiple control samples28. Spectral bleed-through (SBT) and depth-of-field limitations in microscopy significantly affect the accuracy of FRET analysis in cells with varying thickness or morphology. These challenges necessitate advanced correction methods to enhance measurement reliability27,39. To address these challenges, researchers must optimize donor/acceptor fluorophore expression, refine transfection procedures, and conduct robust control experiments to correct non-specific signals and ensure precise data collection28,39. Inadequate control of these factors could lead to erroneous conclusions, but advanced normalization techniques, such as those developed by Hoppe et al.40 and Zal and Gascoigne41, can correct for spectral interference and improve the accuracy of FRET measurements in complex cellular environments. Additionally, advanced FRET normalization methods, as highlighted by Hochreiter et al.42, allow for the quantitative analysis of protein interactions, including stoichiometries and relative affinities in living cells, providing a deeper understanding of protein dynamics under various conditions.
In addition to these technical limitations, integrating computational models of signaling pathways is crucial for enhancing the interpretation of SE-FRET results. These models provide a structured framework to interpret complex biological data. By simulating signaling networks, researchers can better understand the dynamics of molecular interactions and the effects of perturbations, leading to more accurate predictions and insights43,44,45,46. For example, studies of the mTOR pathway have identified bistable switches in Akt activation, where signaling toggles between distinct stable states crucial for regulating processes like cell proliferation and survival47,48. Such models underscore the complexity of Akt signaling, particularly in cancer cells where persistent activation drives disease progression. By integrating real-time SE-FRET imaging with computational models, researchers can gain deeper insights into how feedback loops and temporal shifts in Akt activity influence cellular responses, contributing to a more comprehensive understanding of metabolic diseases and cancer13,48,49,50.
The FRET-based method offers significant advantages over traditional approaches for studying protein-protein interactions and signaling dynamics, particularly in metabolically regulated pathways51. Unlike bulk biochemical assays, FRET imaging provides both spatial and temporal resolution at the single-cell level, allowing real-time observation of dynamic processes in live cells. This ability to track molecular events at the single-cell level provides insights into cellular heterogeneity, which is important for understanding how metabolic shifts (such as those caused by nutrient availability, insulin signaling, or metabolic stress) can impact Akt signaling dynamics. Compared to other fluorescence-based techniques, FRET is uniquely sensitive to changes in the distance between interacting proteins, making it ideal for detecting subtle or transient conformational changes and protein interactions8,9,52. However, bioluminescence resonance energy transfer (BRET) and fluorescence lifetime imaging microscopy with FRET (FLIM-FRET) are advanced techniques for studying protein interactions, each offering unique advantages in specific experimental contexts. BRET utilizes luminescence from luciferase to minimize issues like photobleaching and autofluorescence, making it particularly effective for quantifying membrane protein expression53. Conversely, FLIM-FRET provides high-resolution imaging and quantitative analysis of protein interactions, especially in native conditions, by measuring fluorescence lifetime changes54,55. While these methods have limitations, they offer complementary insights in specific experimental contexts.
The FRET-based protocol for monitoring Akt phosphorylation in live HepG2 cells offers significant insights into cellular signaling, particularly in the context of metabolic diseases like diabetes and cancer. This technique enables real-time visualization of dynamic processes, enhancing the understanding of Akt's role in metabolic regulation and disease pathogenesis27,31,56. The adaptability of methods for studying Akt activation across various cell types significantly enhances their utility in cancer research. This flexibility allows researchers to investigate cell-type-specific signaling mechanisms, which can lead to the identification of potential therapeutic targets13. Furthermore, the robustness of these protocols allows for the investigation of other signaling pathways and protein interactions, enhancing the understanding of cellular processes. The potential for high-throughput adaptation of these methods opens new avenues for drug discovery, particularly in cancer and metabolic diseases12,13,56. The development of novel biosensors that use diverse fluorescent proteins (FPs), along with advanced techniques such as fluorescence lifetime imaging microscopy (FLIM), has significant potential to enhance the utility of FRET-based assays. These innovations improve sensitivity, reduce spectral crosstalk, enable multiplexed imaging, and provide quantitative precision, which expands the applicability of FRET in biomedical research. Such advancements facilitate the investigation of complex signaling networks, high-throughput drug screening, and disease modeling with greater accuracy and reliability.
In conclusion, while SE-FRET presents certain limitations, rigorous controls, and advanced imaging strategies address these challenges. This makes SE-FRET a powerful and versatile tool to elucidate complex cellular dynamics. Its ability to observe real-time, single-cell dynamics offers distinct advantages over bulk assays and provides insights into molecular interactions that may otherwise remain undetected. This capability is particularly important for studying Akt phosphorylation, where understanding the spatial and temporal dynamics of signaling events is crucial for developing targeted therapies for metabolic diseases such as insulin resistance and cancer.
Disclosures
The authors declare no competing interests.
Acknowledgements
This work was partly supported by the Natural Science Foundation of Shenzhen (JCYJ20240813113606009), the Shenzhen-Hong Kong Cooperation Zone for Technology and Innovation (HZQB-KCZYB-2020056), National Natural Science Foundation of China (32070681), National Key R&D Program of China (2019YFA0906002), and Shenzhen Peacock Plan (KQTD2016053117035204).
Materials
| Name | Company | Catalog Number | Comments |
| 0.25% trypsin-EDTA | Gibco | Cat#25200-056 | Use ice-cold PBS for cell wash |
| 15 mm glass bottom cell culture dish | NEST | Cat#801001 | |
| 2 mL Nalgene cryogenic vials | Thermo Scientific | Cat#5012-0020 | |
| 5 mL Stripette Serological Pipets | Corning | Cat#4487 | |
| 95% Ethanol | Kermel | Cat#C028005 | |
| A1 HD25/A1R HD25 confocal microscope | Nikon | https://www.nikon.com/ | Magnification: 40×, Numerical Aperture (NA): 1.30, Pixel Dwell Time: 2.4 ms, Pixel Size: 1024 |
| Ampicillin | Sigma-Aldrich | Cat#A9393 | |
| Bovine serum albumin (BSA) | VWR Life Science | Cat#N208-10g | |
| Corning 25 cm2 rectangular culture flasks | Corning | Cat#430639 | |
| Countess 3 automated cell counter | Thermo Scientific | http://www.thermofisher.com/#AMQAX2000 | |
| Countess cell counting chamber slides | Thermo Scientific | http://www.thermofisher.com/#C10228 | |
| Digital vortex mixers | Thermo Scientific | https://www.thermofisher.com/ | |
| Dimethyl sulfoxide | Sigma-Aldrich | Cat#D2650 | |
| Eppendorf Safe-Lock Tubes 1.5 mL | Eppendorf | Cat#022363204 | |
| EZ-PCR mycoplasma detection kit | Biological Industries | Cat# 20-700-20 | |
| Fetal Bovine Serum, qualified, Australia | Gibco | Cat#10099141 | |
| GlutaMAX Supplement | Gibco | Cat#35050061 | |
| GraphPad Prism 9 | GraphPad Software | https://www.graphpad.com/ | |
| HepG2 | National Collection of Authenticated Cell Cultures | #CSTR:19375.09.3101HUMSCSP510 http://www.cellbank.org.cn/ | |
| Immersion Oil Type 37 | Cargille Laboratories | Cat #16237 | |
| Insulin | Sigma-Aldrich | Cat#I5500-50MG | Warm to 37 °C before use |
| LB Broth (1x) | Invitrogen | Cat#10855001 | |
| Minimum Essential Medium (MEM) | Gibco | Cat#11095080 | Warm to 37 °C before use |
| mySPIN 12 mini centrifuge | Thermo Scientific | https://www.thermofisher.com/ | |
| NanoDrop One | Thermo Scientific | https://www.thermofisher.com | |
| Nikon Plan Fluor 40×/1.30 Oil Lens | Nikon | https://www.nikon.com/ | |
| NIS-Elements-AR | Nikon | https://www.nikon.com/ | |
| Non-Essential Amino Acids (NEAA) (100x) | Gibco | Cat#11140050 | |
| One Shot LB Agar Plates | Invitrogen | Cat#A55802 | |
| One Shot Stbl3 chemically competent E. coli | Invitrogen | Cat#C737303 | |
| Parafilm | PARAFILM | Cat#B8R05606 | |
| PBS (phosphate buffered saline) | Gibco | Cat#10010023 | |
| pEevee-iAkt-NES (7,033 bp) | Miura et al31 | https://benchling.com/s/seq-q46zFYCfl0swLAun0t28/edit | |
| Penicillin-streptomycin | Gibco | Cat#15070063 | |
| Plasmocin prophylactic | InvivoGen | Cat#ant-mpp | |
| Poly-L-Lysine Hydrobromide | Sigma-Aldrich | Cat#P4832 | |
| Precision general purpose baths | Thermo Scientific | https://www.thermofisher.com/ | |
| QIAprep spin miniprep kit | QIAGEN | Cat#27106 | |
| SnapGene | SnapGene by Dotmatics | https://www.snapgene.com | |
| Sodium Pyruvate (100 mM) | Gibco | Cat#11360070 | |
| Syringe filter unit, 0.22 μm | Millipore | Cat#SLGP033RS | |
| Tokai Hit stage top incubator | TOKAI HIT | https://www.tokaihit-livecell.com/stagetopincubator | |
| UltraPure DNase/RNase-free distilled water | Invitrogen | Cat#10977015 | |
| Xfect Transfection Reagent | Takara Bio | Cat#631317 |
References
- GBD 2021 Diabetes Collaborators. Global, regional, and national burden of diabetes from 1990 to 2021, with projections of prevalence to 2050: a systematic analysis for the Global Burden of Disease Study 2021. Lancet. 402 (10397), 203-234 (2023).
- Li, M., et al. Trends in insulin resistance: insights into mechanisms and therapeutic strategy. Signal Transduct Target Ther. 7 (1), 216(2022).
- Poloz, Y., Stambolic, V. Obesity and cancer, a case for insulin signaling. Cell Death Dis. 6 (12), e2037(2015).
- Arcidiacono, B., et al. Insulin resistance and cancer risk: an overview of the pathogenetic mechanisms. Exp Diabetes Res. 2012, 789174(2012).
- Godsland, I. F. Insulin resistance and hyperinsulinaemia in the development and progression of cancer. Clin Sci (Lond). 118 (5), 315-332 (2009).
- Tsugane, S., Inoue, M. Insulin resistance and cancer: epidemiological evidence. Cancer Sci. 101 (5), 1073-1079 (2010).
- Yudhani, R. D., et al. In vitro insulin resistance model: A recent update. J Obes. 2023, 1964732(2023).
- Akhtar, J., et al. Bistable insulin response: The win-win solution for glycemic control. iScience. 25 (12), 105561(2022).
- Akhtar, J., Imran, M., Wang, G. Protocol for live-cell Forster resonance energy transfer imaging to reveal the bistable insulin response of single C2C12-derived myotubes. STAR Protoc. 5 (2), 103109(2024).
- Kamino, K., et al. Optimal inference of molecular interaction dynamics in FRET microscopy. Proc Natl Acad Sci U S A. 120 (15), e2211807120(2023).
- Kraft, A. E., Nikolaev, V. O. FRET microscopy for real-time visualization of second messengers in living cells. Methods Mol Biol. 1563, 85-90 (2017).
- Veeriah, S., et al. High-throughput time-resolved FRET reveals Akt/PKB activation as a poor prognostic marker in breast cancer. Cancer Res. 74 (18), 4983-4995 (2014).
- Conway, J. R. W., et al. Monitoring AKT activity and targeting in live tissue and disease contexts using a real-time Akt-FRET biosensor mouse. Sci Adv. 9 (17), eadf9063(2023).
- Chandris, P., Giannouli, C. C., Panayotou, G. Imaging approaches for the study of metabolism in real time using genetically encoded reporters. Front Cell Dev Biol. 9, 725114(2021).
- Yang, J., et al. Longitudinal FRET imaging of glucose and lactate dynamics and response to therapy in breast cancer cells. Mol Imaging Biol. 24 (1), 144-155 (2022).
- Mandrou, E., et al. A reliable system for quantitative G-protein activation imaging in cancer cells. Cells. 13 (13), 1114(2024).
- Fang, C., Huang, Y., Zhao, Y. Review of FRET biosensing and its application in biomolecular detection. Am J Transl Res. 15 (2), 694-709 (2023).
- Miller, J. N. Fluorescence energy transfer methods in bioanalysis. Analyst. 130 (3), 265-270 (2005).
- Verveer, P. J., Rocks, O., Harpur, A. G., Bastiaens, P. I. Imaging protein interactions by FRET microscopy: FRET measurements by acceptor photobleaching. CSH Protoc. 2006 (6), (2006).
- Vu, C. Q., Arai, S. Quantitative imaging of genetically encoded fluorescence lifetime biosensors. Biosensors (Basel). 13 (10), 939(2023).
- Wang, G. A more holistic view of the logarithmic dose-response curve offers greater insights into insulin response. J Biol Chem. 301 (1), 108037(2025).
- Wang, G. Body mass dynamics is determined by the metabolic Ohm's law and adipocyte-autonomous fat mass homeostasis. iScience. 23 (6), 101176(2020).
- Wang, G. Raison d'être of insulin resistance: the adjustable threshold hypothesis. J R Soc Interface. 11 (101), 20140892(2014).
- Wang, G. Optimal homeostasis necessitates bistable control. J R Soc Interface. 9, 2723(2012).
- Heim, R., Tsien, R. Y. Engineering green fluorescent protein for improved brightness, longer wavelengths and fluorescence resonance energy transfer. Curr Biol. 6 (2), 178-182 (1996).
- Nguyen, A. W., Daugherty, P. S. Evolutionary optimization of fluorescent proteins for intracellular FRET. Nat Biotechnol. 23 (3), 355-360 (2005).
- Broussard, J. A., Rappaz, B., Webb, D. J., Brown, C. M. Fluorescence resonance energy transfer microscopy as demonstrated by measuring the activation of the serine/threonine kinase Akt. Nat Protoc. 8 (2), 265-281 (2013).
- Gordon, G. W., Berry, G., Liang, X. H., Levine, B., Herman, B. Quantitative fluorescence resonance energy transfer measurements using fluorescence microscopy. Biophys J. 74 (5), 2702-2713 (1998).
- Tron, L., et al. Flow cytometric measurement of fluorescence resonance energy transfer on cell surfaces. Quantitative evaluation of the transfer efficiency on a cell-by-cell basis. Biophys J. 45 (5), 939-946 (1984).
- Calibration of fluorescence resonance energy transfer in microscopy. , US 6456734 United States Patent and Trademark Office (2002).
- Miura, H., Matsuda, M., Aoki, K. Development of a FRET biosensor with high specificity for Akt. Cell Struct Funct. 39 (1), 9-20 (2014).
- Liberio, M. S., Sadowski, M. C., Soekmadji, C., Davis, R. A., Nelson, C. C. Differential effects of tissue culture coating substrates on prostate cancer cell adherence, morphology and behavior. PLoS One. 9 (11), e112122(2014).
- Rani, K., Sengupta, S. Multi-stimuli programmable FRET based RGB absorbing antennae towards ratiometric temperature, pH and multiple metal ion sensing. Chem Sci. 12 (47), 15533-15542 (2021).
- Betolngar, D. B., et al. pH sensitivity of FRET reporters based on cyan and yellow fluorescent proteins. Anal Bioanal Chem. 407 (14), 4183-4193 (2015).
- Salonikidis, P. S., et al. An ion-insensitive cAMP biosensor for long term quantitative ratiometric fluorescence resonance energy transfer (FRET) measurements under variable physiological conditions. J Biol Chem. 286 (26), 23419-23431 (2011).
- Youvan, D. C., et al. Calibration of fluorescence resonance energy transfer in microscopy using genetically engineered GFP derivatives on nickel chelating beads. Biotechnol Alia. 3, 1-18 (1997).
- Menaesse, A., et al. Simplified instrument calibration for wide-field fluorescence resonance energy transfer (FRET) measured by the sensitized emission method. Cytometry A. 99 (4), 407-416 (2021).
- Batta, A., Hajdu, T., Nagy, P. Improved estimation of the ratio of detection efficiencies of excited acceptors and donors for FRET measurements. Cytometry A. 103 (7), 563-574 (2023).
- Coullomb, A., et al. QuanTI-FRET: a framework for quantitative FRET measurements in living cells. Sci Rep. 10 (1), 6504(2020).
- Hoppe, A., Christensen, K., Swanson, J. A. Fluorescence resonance energy transfer-based stoichiometry in living cells. Biophys J. 83 (6), 3652-3664 (2002).
- Zal, T., Gascoigne, N. R. Photobleaching-corrected FRET efficiency imaging of live cells. Biophys J. 86 (6), 3923-3939 (2004).
- Hochreiter, B., Kunze, M., Moser, B., Schmid, J. A. Advanced FRET normalization allows quantitative analysis of protein interactions including stoichiometries and relative affinities in living cells. Sci Rep. 9 (1), 8233(2019).
- Liu, H., Zhang, F., Mishra, S. K., Zhou, S., Zheng, J. Knowledge-guided fuzzy logic modeling to infer cellular signaling networks from proteomic data. Sci Rep. 6, 35652(2016).
- Garrido-Rodriguez, M., Zirngibl, K., Ivanova, O., Lobentanzer, S., Saez-Rodriguez, J. Integrating knowledge and omics to decipher mechanisms via large-scale models of signaling networks. Mol Syst Biol. 18 (7), e11036(2022).
- Greenwald, E. C., Polanowska-Grabowska, R. K., Saucerman, J. J. Integrating fluorescent biosensor data using computational models. Methods Mol Biol. 1071, 227-248 (2014).
- Zhao, Z., Xia, J. Computational Approaches for Modeling Signal Transduction Networks. Encyclopedia of Bioinformatics and Computational Biology. , Elsevier. Cambridge, MA. (2019).
- Wang, G., Krueger, G. R. Computational analysis of mTOR signaling pathway: bifurcation, carcinogenesis, and drug discovery. Anticancer Res. 30 (7), 2683-2688 (2010).
- Wang, G. Singularity analysis of the AKT signaling pathway reveals connections between cancer and metabolic diseases. Phys Biol. 7 (4), 046015(2010).
- Chedere, A., Hari, K., Kumar, S., Rangarajan, A., Jolly, M. K. Multi-stability and consequent phenotypic plasticity in AMPK-Akt double negative feedback loop in cancer cells. J Clin Med. 10 (3), 472(2021).
- Mosca, E., et al. Computational modeling of the metabolic States regulated by the kinase akt. Front Physiol. 3, 418(2012).
- Liao, J., Madahar, V., Dang, R., Jiang, L. Quantitative FRET (qFRET) technology for the determination of protein-protein interaction affinity in solution. Molecules. 26 (21), 6339(2021).
- Verma, A. K., Noumani, A., Yadav, A. K., Solanki, P. R. FRET based biosensor: Principle applications recent advances and challenges. Diagnostics (Basel). 13 (8), 1375(2023).
- Mattheisen, J. M., et al. Application of bioluminescence resonance energy transfer to quantitate cell-surface expression of membrane proteins. Anal Biochem. 684, 115361(2024).
- Lionetti, M. C., La Porta, C. A. M. FLIM-FRET investigation of heterogeneous huntingtin aggregation in HeLa cells. Methods Mol Biol. 2551, 595-604 (2023).
- Petutschnig, E. K., Pierdzig, L., Mittendorf, J., Niebisch, J. M., Lipka, V. A novel fluorescent protein pair facilitates FLIM-FRET analysis of plant immune receptor interaction under native conditions. J Exp Bot. 75 (3), 746-759 (2024).
- Sprenger, J. U., Perera, R. K., Gotz, K. R., Nikolaev, V. O. FRET microscopy for real-time monitoring of signaling events in live cells using unimolecular biosensors. J Vis Exp. 66, e4081(2012).
Reprints and Permissions
Request permission to reuse the text or figures of this JoVE article
Request PermissionThis article has been published
Video Coming Soon
Copyright © 2025 MyJoVE Corporation. All rights reserved