Sieve analysis is a method used to determine the particle size distribution of aggregate materials. This process involves the following steps:
- The required quantity of dried sample of aggregate is weighed.
- The weighed aggregates are sieved through a set of sieves with square openings arranged in descending order of aperture size, with the largest mesh on top (Column 1 of Table 1).
- The stack of sieves is shaken or vibrated to facilitate the sorting of particles by size.
- After sieving for a specific period, the material retained on each sieve is weighed (Column 2 of Table 1).
- The weight of particles retained on each sieve is expressed as a percentage of the total sample mass (Column 3 of Table 1).

- The cumulative percentage passing each sieve is calculated to the nearest one percent from the finest sieve moving upwards (Column 4 of Table 1).
- The grading curve is plotted on a graph (Figure 1) where the ordinate values represent the percentage passing (Column 4 of Table 1), and the abscissa values show the sieve apertures (Column 1 of Table 1), set to a logarithmic scale.
Table 1: Data for sieve analysis on sand
| Column 1 | Column 2 | Column 3 | Column 4 |
| ASTM Sieve (Sieve size) | Weight retained on each sieve (g) | Percentage weight retained on each sieve (%) | Cumulative Percentage passing each sieve (%) |
| ⅜ inch (9.5 mm) | 0 | 0 | 98+2 = 100 |
| No. 4 (4.75 mm) | 10 | 2 | 88+10 = 98 |
| No. 8 (2.36mm) | 50 | 10 | 79+9 = 88 |
| No. 16 (1.18 mm) | 45 | 9 | 61+18 = 79 |
| No. 30 (600 µ) | 90 | 18 | 29+32 = 61 |
| No. 50 (300 µ) | 160 | 32 | 10+19 = 29 |
| No. 100 (150 µ) | 95 | 19 | 10 |
| Bottom pan | 50 | 10 | |
| Total weight of aggregate = 500 g | |||
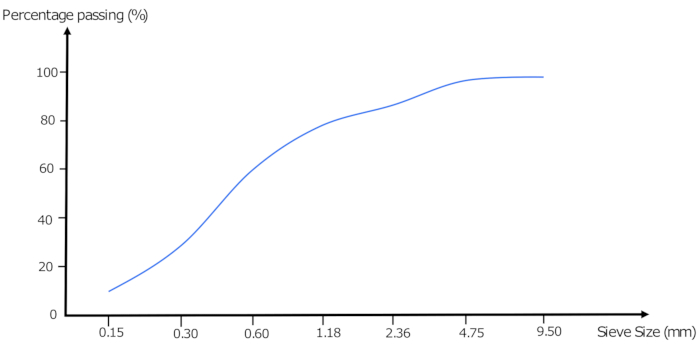
Grading curves visually simplifies the distribution of particle sizes and is essential for ensuring that aggregates meet the required grading specifications for construction projects.
Del capítulo 5:

Now Playing
5.3 : Sieve Analysis and Grading Curves
Aggregates and Water
201 Vistas

5.1 : Unsoundness of Aggregate due to Volume Change
Aggregates and Water
75 Vistas

5.2 : Deleterious Substances in Aggregate
Aggregates and Water
120 Vistas

5.4 : Fineness Modulus
Aggregates and Water
172 Vistas

5.5 : Types of Aggregate Grading
Aggregates and Water
277 Vistas

5.6 : Maximum Size of Aggregate
Aggregates and Water
48 Vistas

5.7 : Quality of Water
Aggregates and Water
67 Vistas

5.8 : Testing Water Quality
Aggregates and Water
82 Vistas

5.9 : Aggregates Classification
Aggregates and Water
288 Vistas

5.10 : Shape and Texture of Coarse Aggregate
Aggregates and Water
150 Vistas

5.11 : Bonding and Strength of Aggregate
Aggregates and Water
115 Vistas

5.12 : Toughness and Hardness of Aggregate
Aggregates and Water
199 Vistas

5.13 : Specific Gravity of Aggregate
Aggregates and Water
163 Vistas

5.14 : Bulk Density of Aggregate
Aggregates and Water
357 Vistas

5.15 : Porosity and Absorption of Aggregate
Aggregates and Water
225 Vistas
See More
ACERCA DE JoVE
Copyright © 2025 MyJoVE Corporation. Todos los derechos reservados