All
Research
Education
Business
Solutions
EN
EN - English
CN - 中文
DE - Deutsch
ES - Español
KR - 한국어
IT - Italiano
FR - Français
PT - Português
TR - Türkçe
JA - 日本語
PL - Polski
RU - Русский
HE - עִברִית
AR - العربية
Sign In
Chapter 3
Descriptive statistics describe or summarize relevant characteristics of a sample and aid in the analysis of data of interest. When analyzing large ...
The arithmetic mean is the most commonly used measure of the central tendency of a data set. It is defined as the sum of all the elements constituting the ...
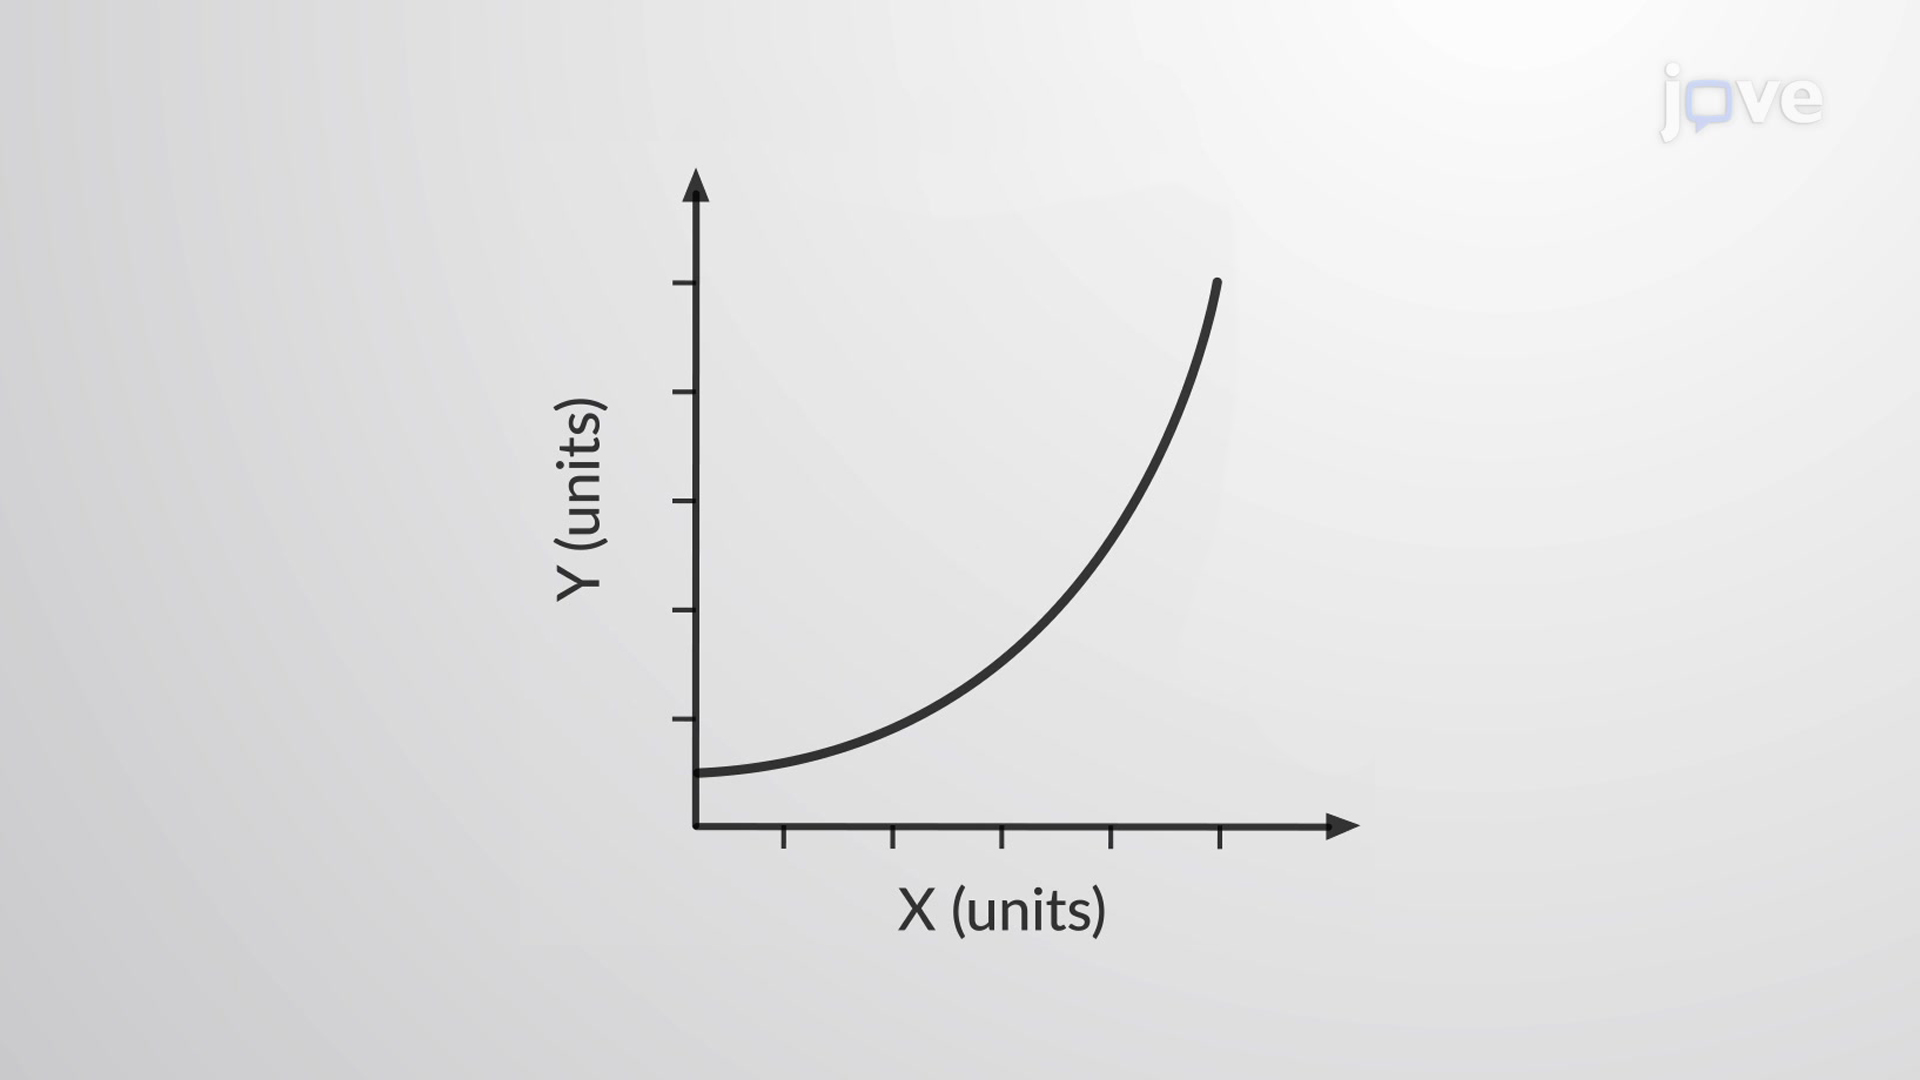
The mean is a measure of the central tendency of a data set. In some data sets, the data is inherently multiplicative, and the arithmetic mean is not ...
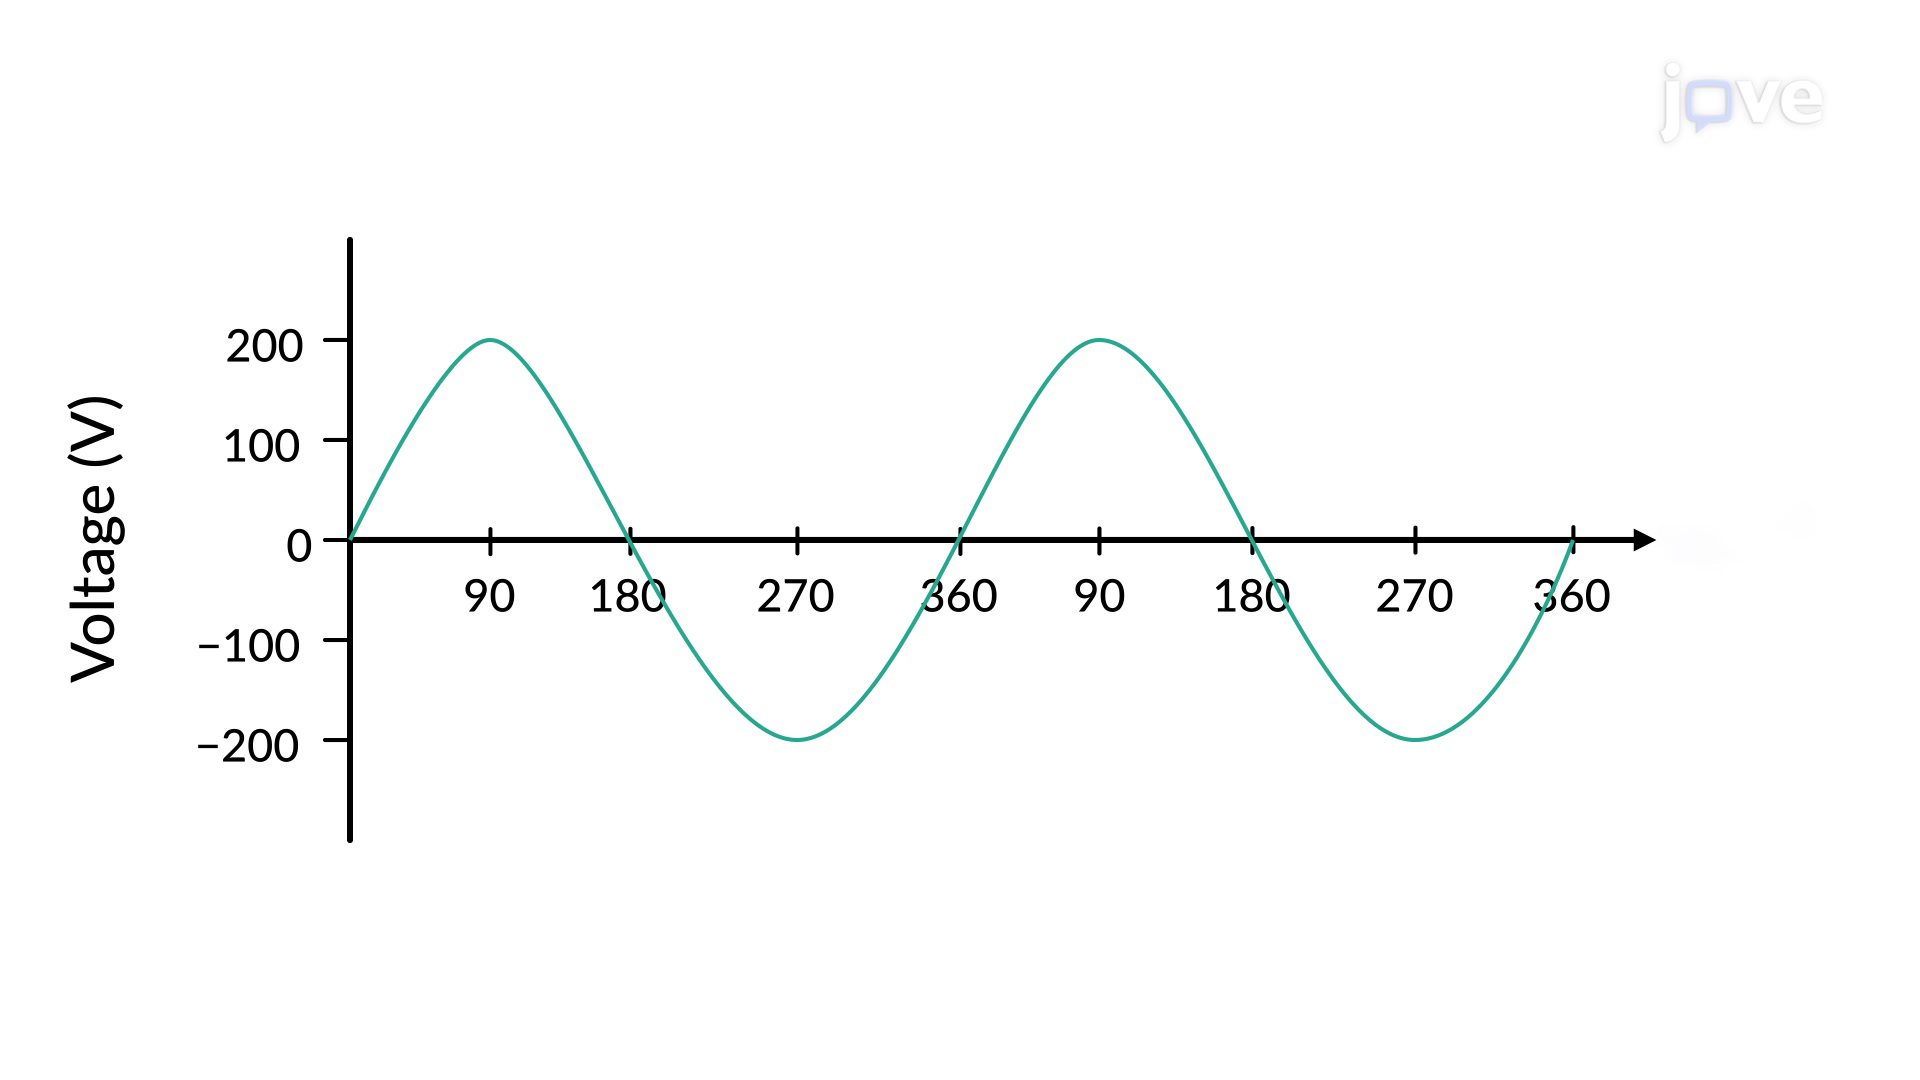
The arithmetic mean is usually skewed towards the larger values in the data set. Therefore, to avoid this inherent bias towards smaller values, the ...
While measuring the mean of a data set, care needs to be taken when associating the mean to its central tendency. The same goes for the arithmetic mean, ...
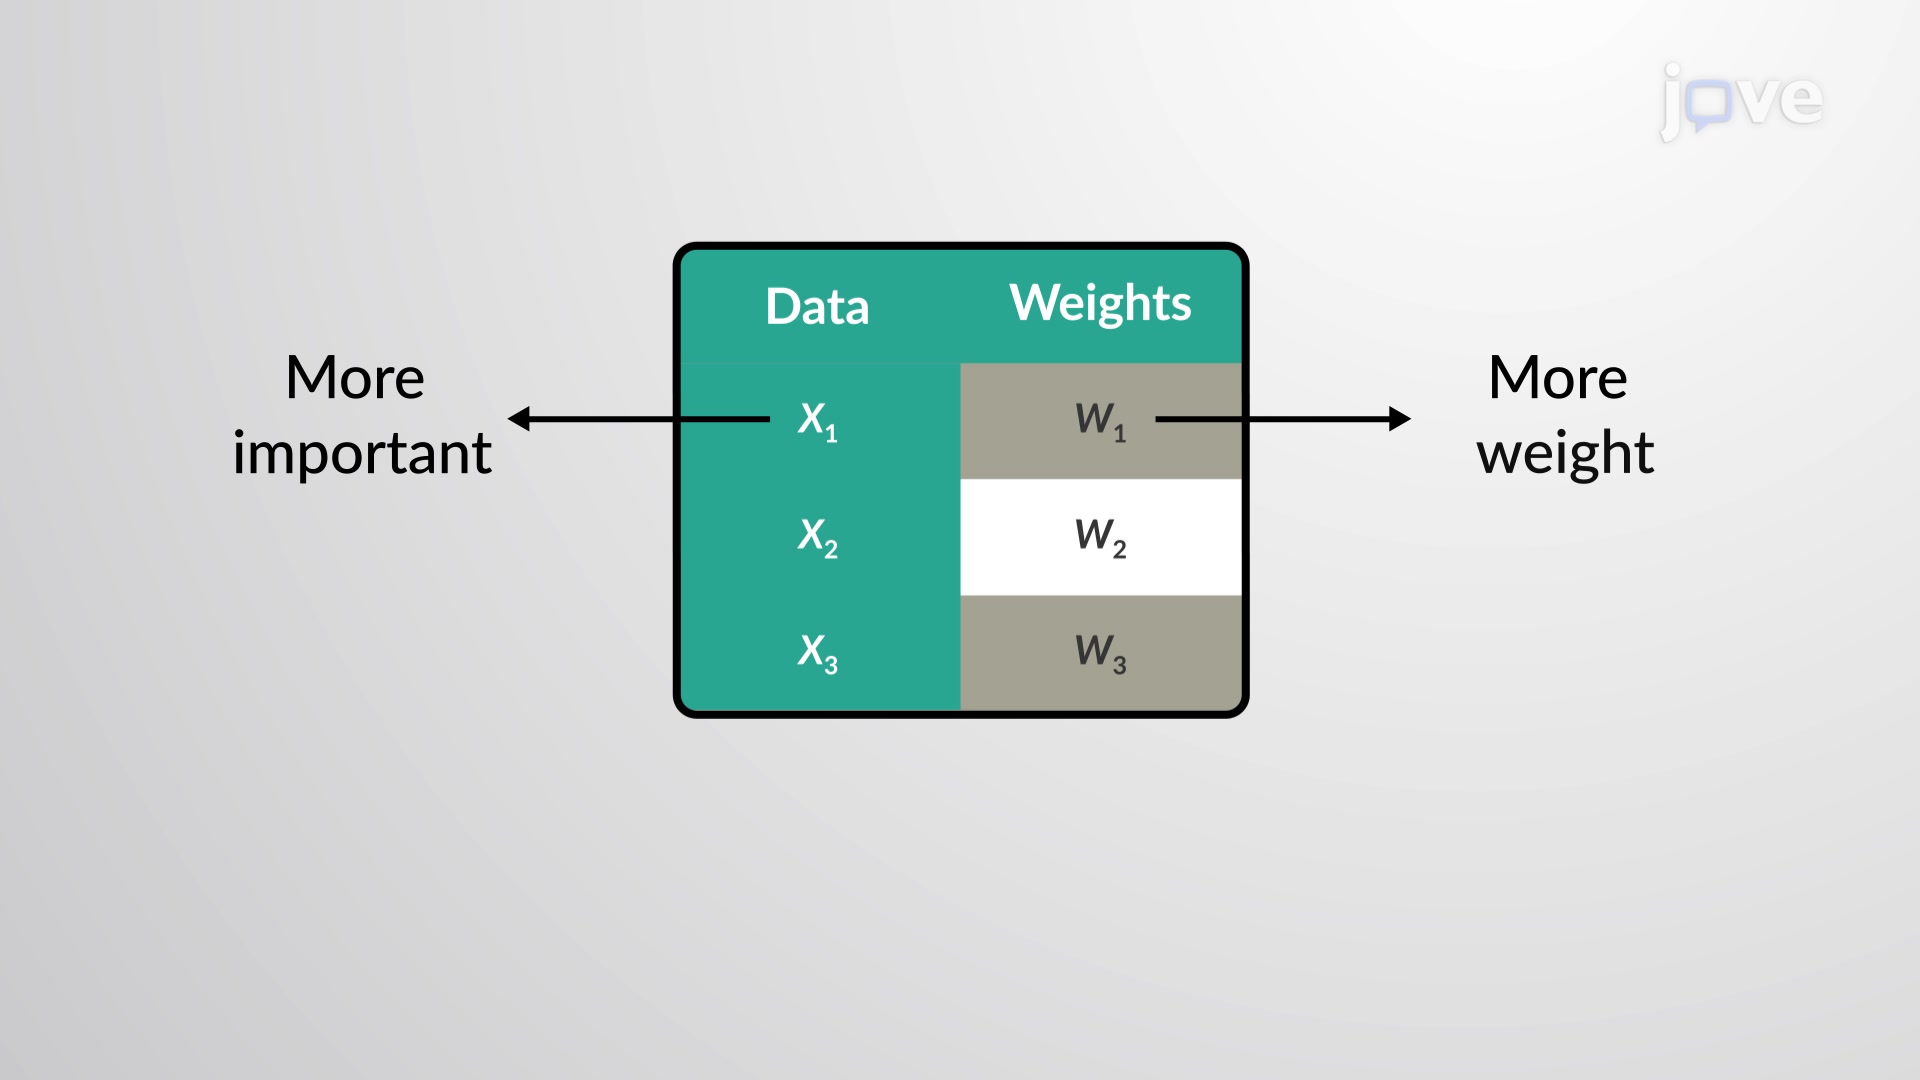
While taking the arithmetic, geometric, or harmonic mean of a sample data set, equal importance is assigned to all the data points. However, all the ...
If in an experiment, data values have a probability of being both positive and negative, neither the arithmetic mean, the geometric mean, nor the harmonic ...
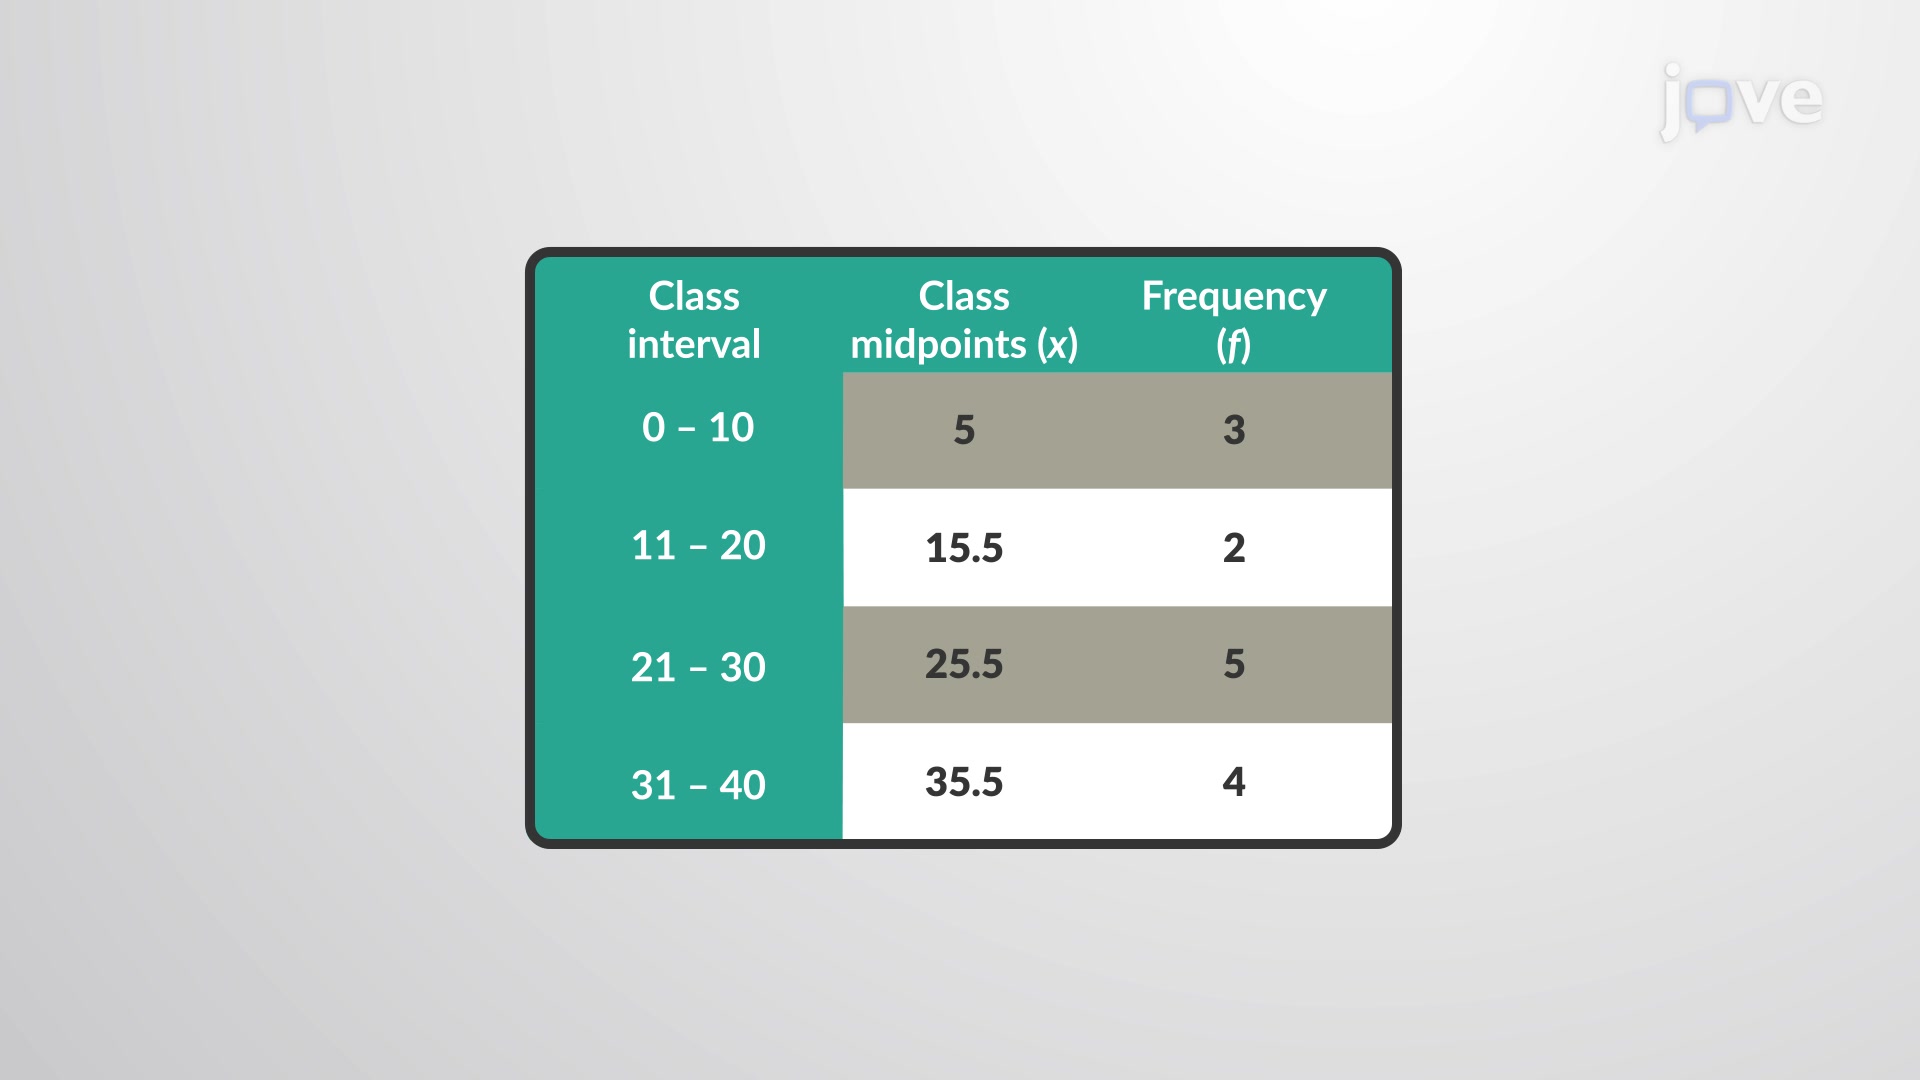
Sometimes, data gathered from an experiment on a large sample or population are organized into concise tables. In such cases, the frequency of the ...
The mode is one of the commonly used measures of a central tendency. It is defined as the most frequent value in a data set. There can be more than one ...
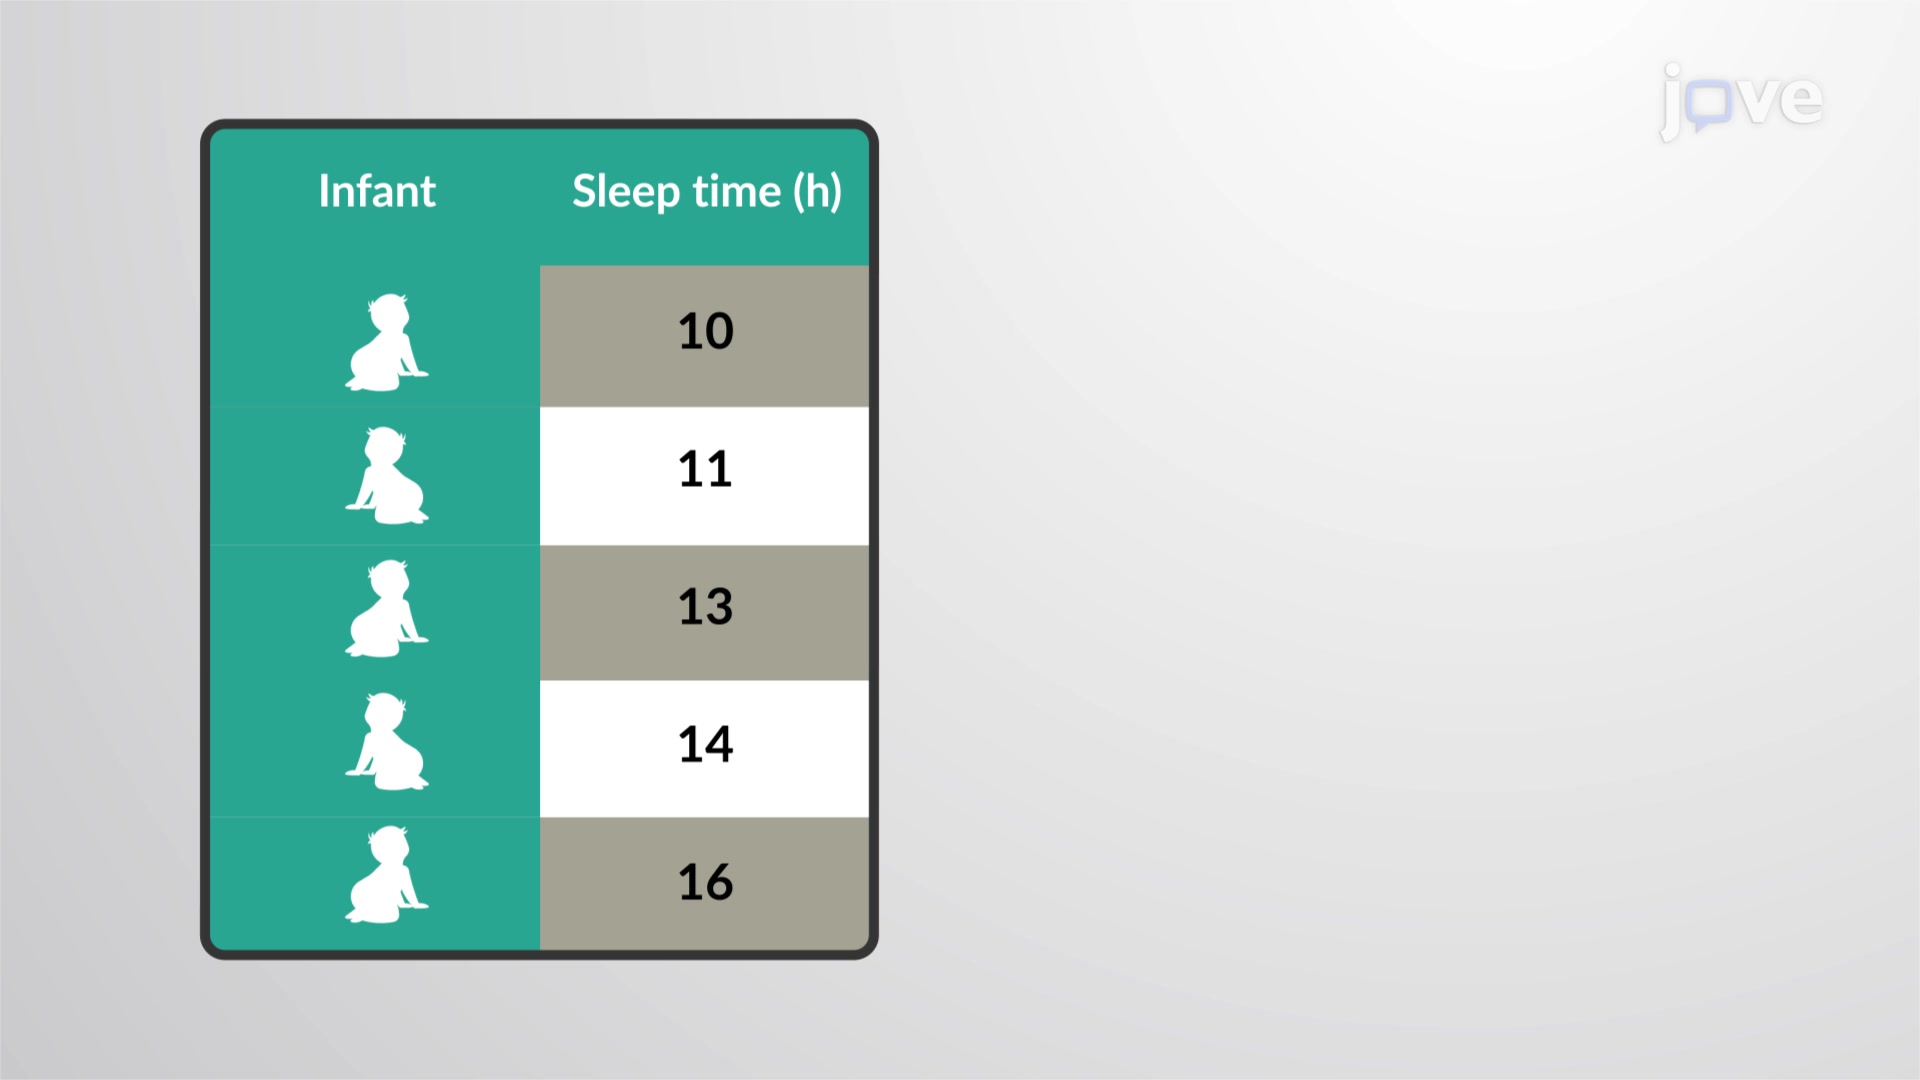
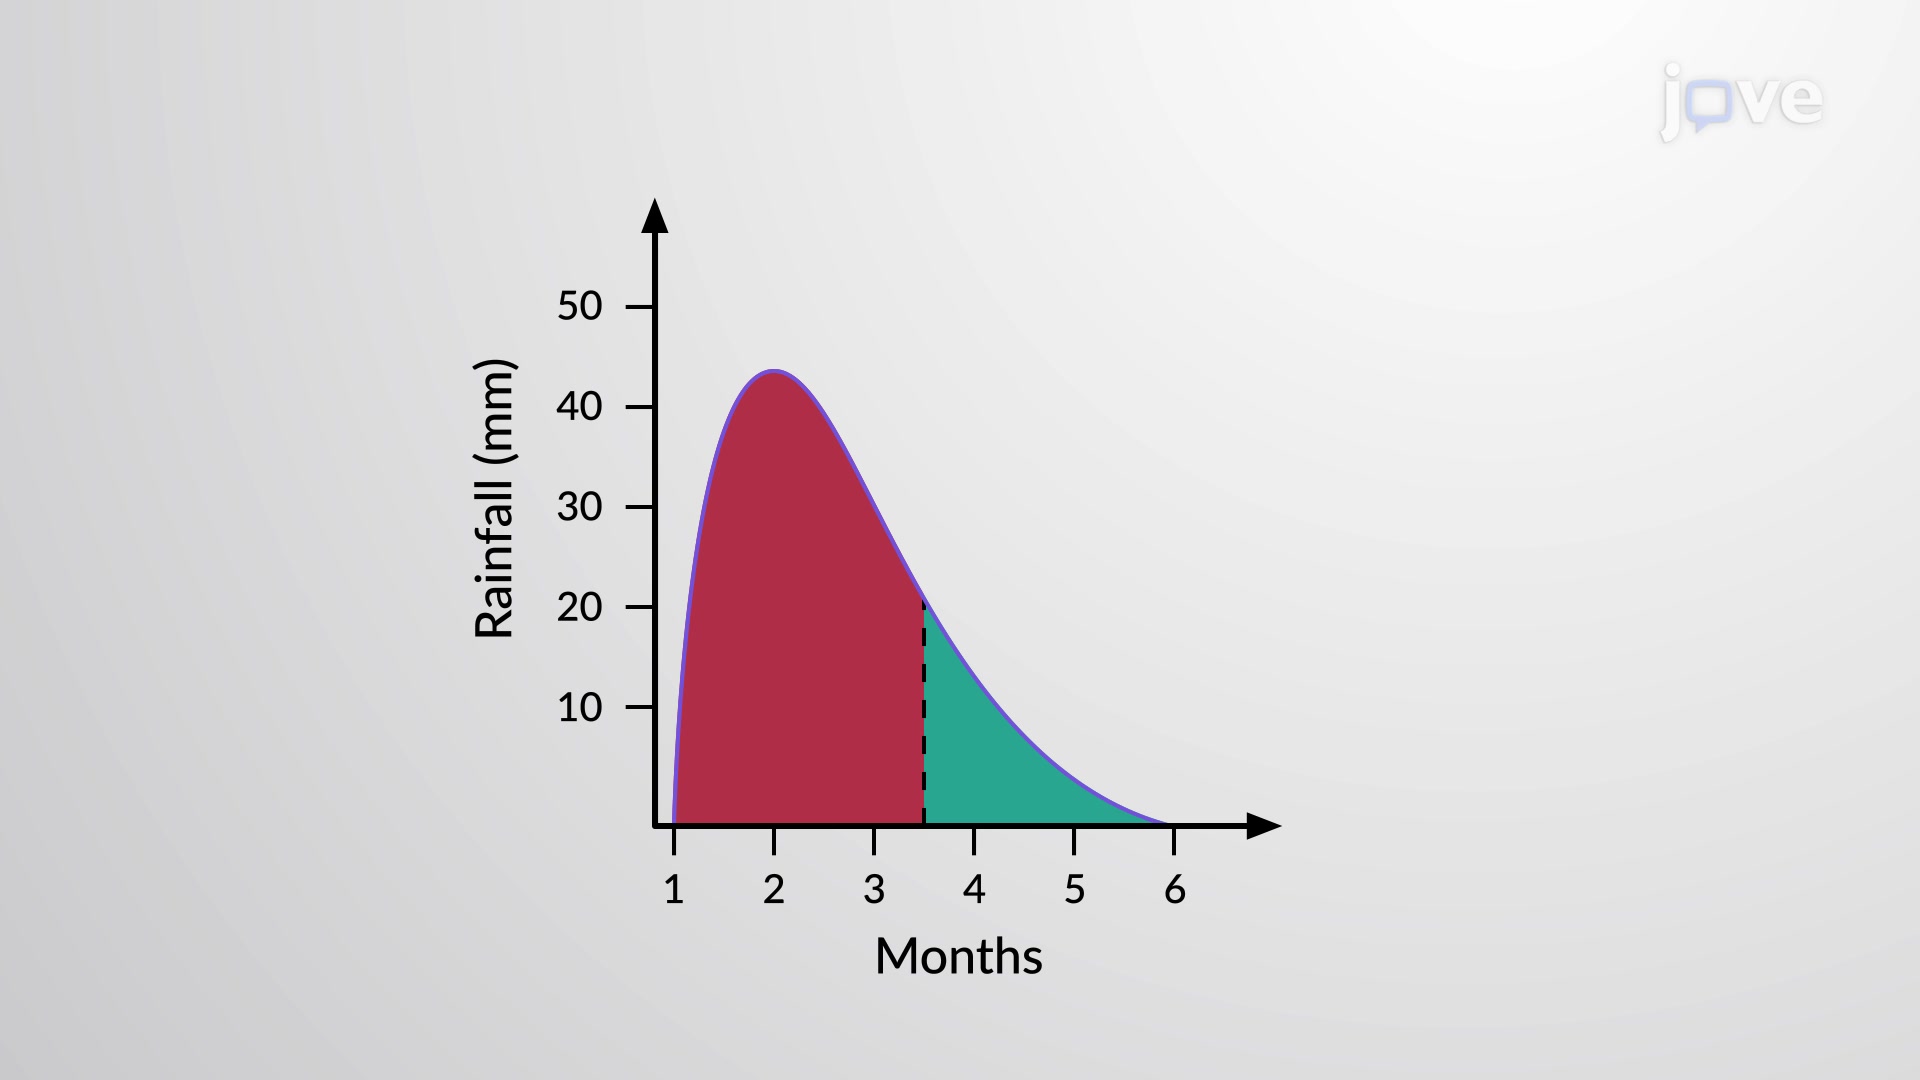
Besides mean, the median is a widely used measure of central tendency. Typically, median is defined as the central or middle value of a data set, measured ...
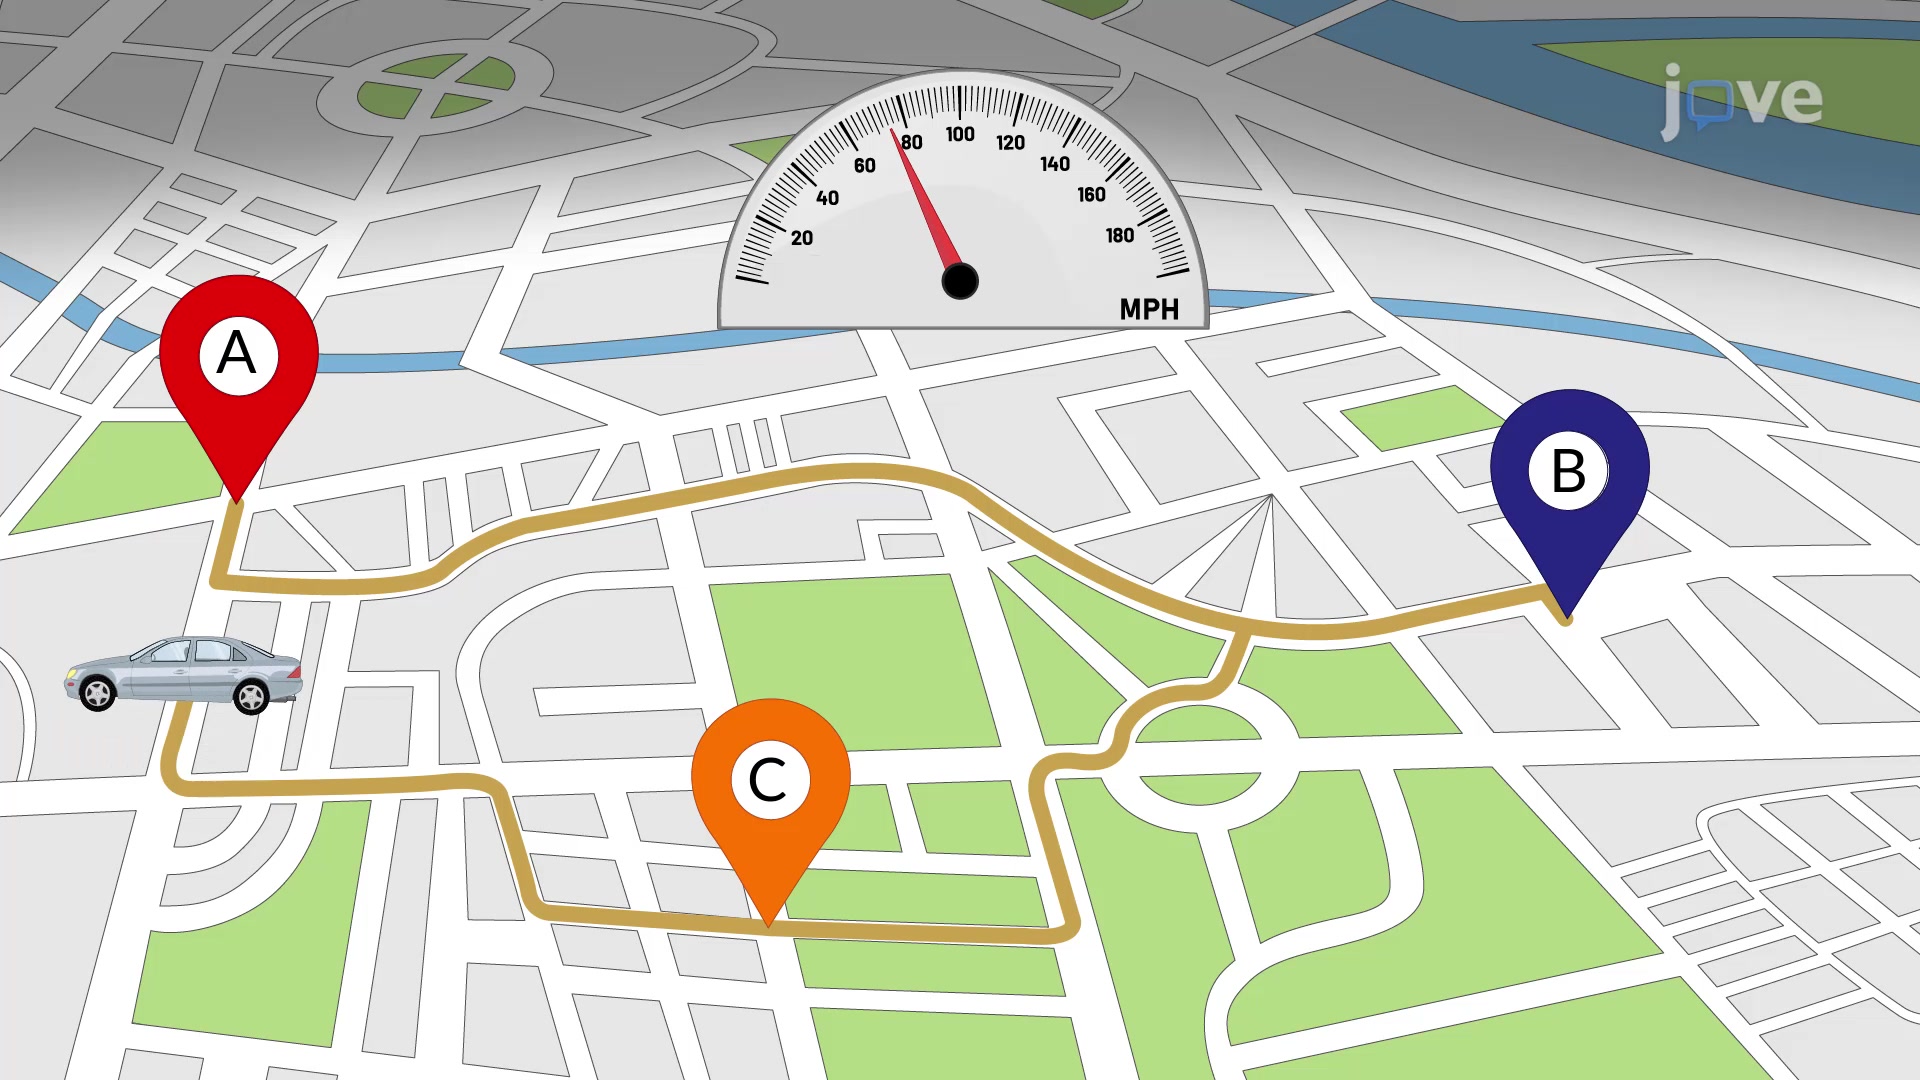
A somewhat easy to compute quantitative estimate of a data set’s central tendency is its midrange, which is defined as the mean of the minimum and ...
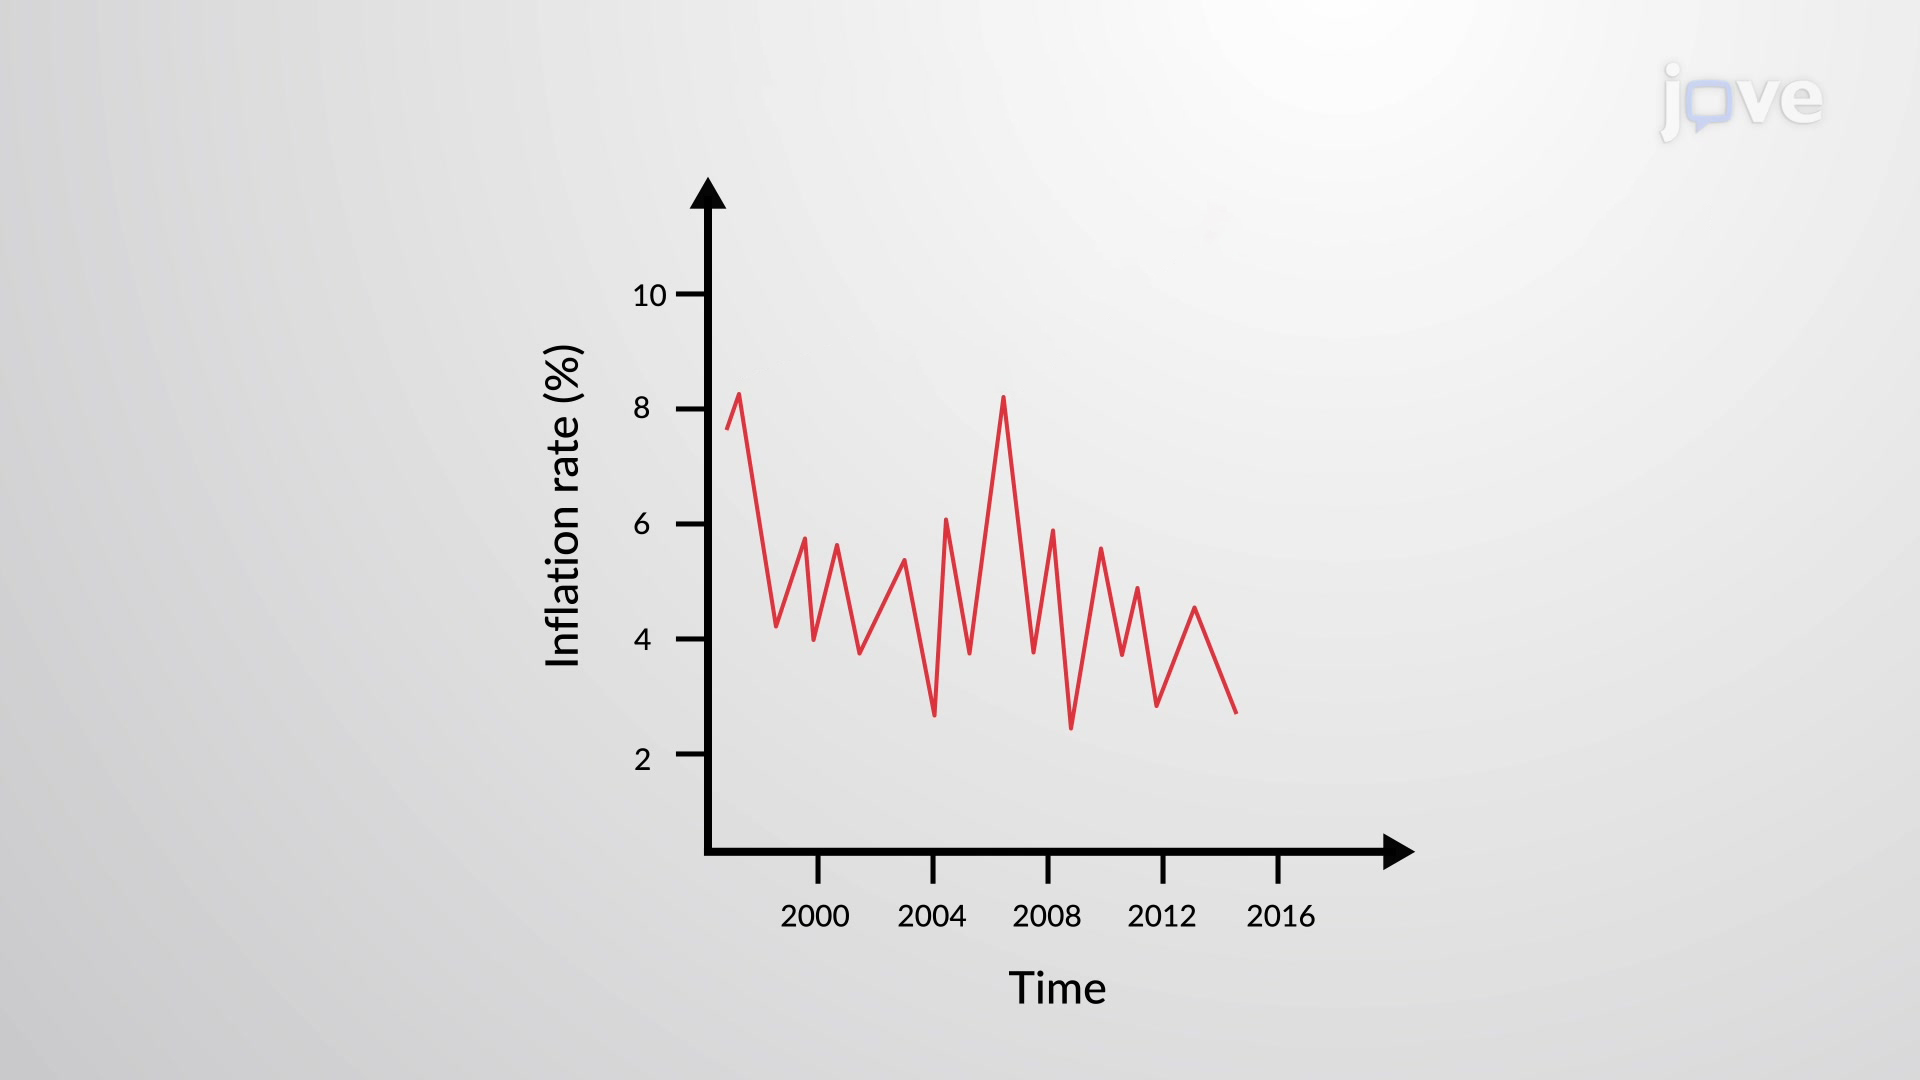
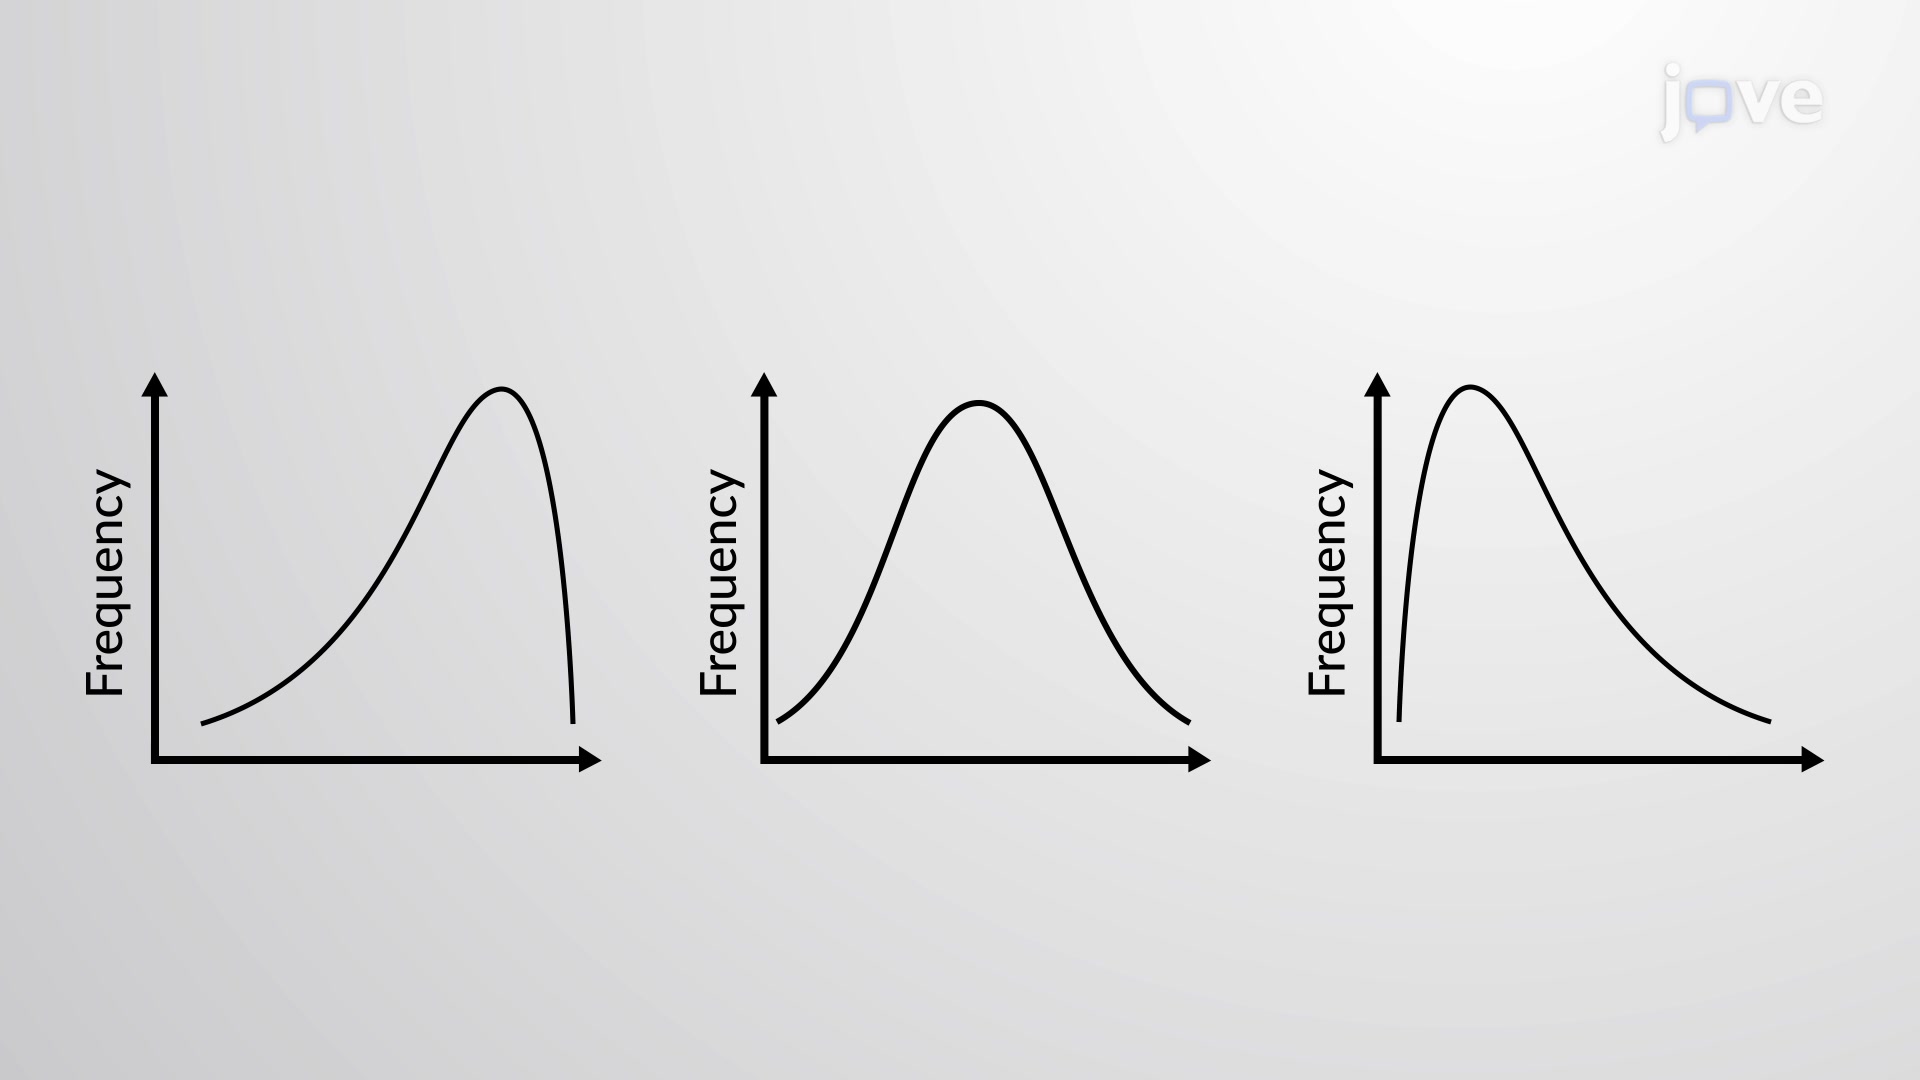
The measures of central tendency calculated from a data set may not reveal much about its intrinsic distribution. If a plot is made of the data ...
If the frequency distribution of a data set is more inclined towards smaller or larger values, the distribution is said to be skewed. If data values are ...
Privacy
Terms of Use
Policies
Contact Us
Recommend to library
JoVE NEWSLETTERS
JoVE Journal
Methods Collections
JoVE Encyclopedia of Experiments
Archive
JoVE Core
JoVE Science Education
JoVE Lab Manual
JoVE Quiz
JoVE Playlist
Authors
Librarians
Access
ABOUT JoVE
JoVE Sitemap
Copyright © 2025 MyJoVE Corporation. All rights reserved