Method Article
Applying Cheminformatics to Develop a Structure Searchable Database of Analytical Methods
In This Article
Summary
This article describes AMOS, the web-based Analytical Methods and Open Spectra database, a cheminformatics application designed to provide researchers with easy access to analytical methods and spectral data.
Abstract
Analytical methods can range from detailed regulatory documents to simpler summaries. Regulatory methods may include information on amenable analytes, supported matrices, required reagents, statistical performance, interlaboratory validation, and other specifics. Summaries typically provide a general overview of reagents, instrumentation, and often a short list of analytes. Analytical methods from U.S. government bodies, including the U.S. Environmental Protection Agency (USEPA), U.S. Geological Survey (USGS), U.S. Department of Agriculture (USDA), the Food and Drug Administration (FDA), and others, offer detailed procedural information. Instrument vendors such as Agilent, Shimadzu, Thermo Fisher Scientific, Sciex, and others also provide access to hundreds of application notes, which may be considered summary methods. This study has developed a cheminformatics-enabled database of methods in which chemicals are extracted from method documents, with identifiers (names and/or Chemical Abstracts Service registry numbers (CASRN)) mapped to chemical structures. The resulting database, containing approximately 7,000 methods, is searchable by identifier, chemical structure, and structural similarity, and is supplemented by approximately one million public domain spectra (LC/MS, GC/MS, NMR, and IR). The application supports searching of analytical methods and filtering based on analytes, functional usage, method sources, and other related metadata.
Introduction
Web-based delivery of chemistry data to the community is exemplified by applications such as PubChem1, ChemSpider2, and the CompTox Chemicals Dashboard (CCD)3. Efforts have been made to circulate analytical method details published in journal articles, released by instrument vendors as technical application notes, provided by government agencies as standard operating procedures or regulatory methods, and issued by standards organizations such as the International Organization for Standardization (ISO). Tens of thousands of chemicals have been studied by these sources under a wide range of conditions and analytical techniques. This extensive body of sources covers diverse substances and includes scenarios ranging from the quantification of a single chemical in a specific matrix (e.g., blood), to mixtures of pesticides and their residues in specific crops, to hundreds of chemicals identified in drinking water. While many analytical methods can be discovered via public search engines, not all are freely available or open-access.
Locating specific information of interest can be challenging. General-purpose search engines are not optimized for chemistry data, and their ranking algorithms may obscure high-quality content intended for narrow audiences. Searches across journal websites can yield more targeted results, but access is often restricted, with only abstracts publicly available, making it difficult to assess a method's usefulness. Furthermore, critical parameters-such as sample matrices, limits of detection, and quantitation-are often not stored in a structured format. Another significant challenge lies in the variation and inconsistency of chemical identifiers, names, and synonyms associated with a single chemical. The lack of structured methods data limits the development of software tools that could leverage decades of accumulated analytical chemistry knowledge and related publications.
As a result of these challenges and limitations, there is a need for a curated, chemistry-oriented application for harmonizing and searching analytical methods-one that was not identified elsewhere. To address this gap, the U.S. Environmental Protection Agency developed AMOS, the Analytical Methods and Open Spectra database and web-based application. AMOS currently collects and organizes three types of data records: analytical methods, various analytical spectra, and a broad category of supplemental documents collectively referred to as fact sheets. Each record is linked to the method's target chemical analytes and reagents. The data are searchable in multiple ways, including by text queries, chemical structure, and structural or spectral similarity.
The AMOS application primarily focuses on delivering open access and open data records. Where possible, records in the database are hyperlinked to their original sources. Records not under open licensing and therefore not stored directly in the database can still be integrated and accessed via URL, provided they are otherwise available. This applies to two types of records: analytical methods that are behind paywalls, typically from journals or standards organizations to which the EPA has access, and spectra that are available but require login access.
Data sources vary in how records are structured, necessitating substantial effort in extraction and curation to assemble and harmonize the content. Most records provide substance identifiers (e.g., CASRN, DTXSID, InChIKey, common names), and in many cases, extraction is straightforward. However, matching these identifiers to chemical structures and substance details can be complex. Some identifiers can be directly matched to entries in the EPA's Distributed Structure-Searchable Toxicity (DSSTox) database4; when matches are not found, identifiers are linked to existing substances, or new substances are registered. The AMOS initiative has consequently led to the expansion of the DSSTox database, improving the foundational data supporting other EPA databases and applications, such as the CompTox Chemicals Dashboard3.
Manual curation is required for certain valuable additional information. For analytical methods, experimental parameters such as limits of detection and quantitation, sample matrix, and analytical methodology are not organized in a standardized way, and automated tools cannot identify this information due to its inconsistent storage.
Two elements of record information, the media associated with the sample and the functional use of the analyte, are highly relevant to ongoing efforts to monitor hazard and exposure concerns from contaminants. As such, considerable attention was given to structuring these attributes within the record data. An ontology of functional use classifications was developed for this project. This ontology organizes the functional uses of substances into a hierarchical structure, ranging from more general 'parent' uses to more specific 'child' uses. The ontology facilitates the exploration of substances from an application perspective, supporting research initiatives that emphasize functional uses as a means to assess exposure and hazard5,6. Additionally, methods were labeled according to their samples' harmonized media category, as specified in the EPA's multimedia monitoring database (MMDB)7. This categorization enables the search for chemicals based on their occurrence in specific media, streamlining the development of solutions focused on detecting chemicals in specific environmental or biological samples. These annotations enhance the integration of AMOS into exposure- and hazard-oriented workflows under development within the EPA.
In assembling the spectra, the challenge of processing various file formats-some of which are only nominally standardized-and parsing accompanying metadata often requires custom handling. In cases where spectral collections are linked to a publication, details documented within the publication may need to be manually extracted for data loading. This effort has resulted in a database that integrates and structures these disparate spectra, allowing researchers to avoid the need for laborious curation in future endeavors.
As of March 2025, the database contains approximately 935,000 spectra, with nearly 99% being mass spectra and smaller collections of NMR (~2,000) and IR (~400). Additionally, there are approximately 770,000 externally linked spectra (connected to the SpectraBase database8), ~36,000 fact sheets, and ~7,400 analytical methods. The substances integrated into the application are a subset of those from the DSSTox database, which is incorporated into the CompTox Chemicals Dashboard (CCD) and contains over 1.2 million substances.
Protocol
The majority of AMOS's functionality can be broken down into three categories: searching for records for given substances, searching for certain collections of substances, or searching among categories of records. The individual pages for these functionalities can all be accessed from the navigation bar at the top of every page. The application is currently deployed at https://hcd.rtpnc.epa.gov/#/ via the AMOS module. The software tools utilized in this study are listed in the Table of Materials.
1. Searching for records for specific substances
- General search: Perform a general search to obtain a list of all types of records associated with a single substance (see Figure 1).
- In either the text field at the top left of the navigation bar or the search field on the front page, input a substance name, CASRN, InChIKey, or DSSTox substance identifier (DTXSID). Hit Enter or click on Search to execute the search.
NOTE: The search bar on the front page has an additional option to search by substring; see the section on the partial identifier search (step 2.2) for more information. - If the searched identifier is recognized and matches a single substance, the left side of the page will display some basic information about the substance and a table listing all records associated with that substance. Select a row in that table to display the associated record on the right side of the page if it is stored directly in the database.
- If the searched identifier matches multiple substances - e.g., an abbreviation that is used for more than one substance - a disambiguation prompt will appear to let the user select which substance they want to see. Select a substance from that list, and one will be redirected to the display for a recognized substance.
- To filter the table of results, click the tabs just above the table to filter by record type (this will also hide and unhide different columns), input text into fields at the top of the table to filter on other aspects of the data, and select the checkboxes above the tabs to filter on broader properties of the data.
- In either the text field at the top left of the navigation bar or the search field on the front page, input a substance name, CASRN, InChIKey, or DSSTox substance identifier (DTXSID). Hit Enter or click on Search to execute the search.
- Batch search: Perform a batch search to generate and download a spreadsheet file that lists information on all records in the database that are associated with a given list of substances. (see Figure 2).
- In the input data field, enter a list of DTXSIDs to be searched, one per line. If DTXSIDs are not available, use the link on the page to navigate to a CCD tool that can supply DTXSIDs given other identifiers.
- Use the checkboxes under Search Options to filter out results or append additional information to records. The options are grouped in five categories: filtering by record types, filtering by analytical methodologies, appending additional substance-level information to the result file, appending additional record-level info (currently just available for mass spectra), and some miscellaneous options.
NOTE: Options with a dashed underline have text that explains the option more thoroughly. Hover the cursor over the option's label to see it. - Click on Search at the bottom of the page to execute the search.
NOTE: The output spreadsheet contains a list of substance-record associations along with substance identifiers, source links, and some other basic information. If multiple searched substances appear in a record, the record will appear once for each substance.
- Structural similarity search: Perform this search to obtain lists of methods and fact sheets in the database that contain either the searched substance or one with a sufficiently high Tanimoto structural similarity coefficient (see Figure 3).
NOTE: This search can be useful in cases where a substance of interest does not appear in any methods, but methods with highly similar substances could potentially be used as a reference.- Input a DTXSID, InChIKey, CASRN, or substance name into the search field and click on Search or hit Enter. The search may take 20-30 s to complete.
- Once the search is complete, a tabbed table will appear below. Select a tab to look through the results from the search.
- The first two tabs list the methods and fact sheets that were found. Select one to bring up a view of that document on the right-hand side of the page. Methods or fact sheets that contain the searched substance are in a bold font.
- The third tab lists similar substances that were found to appear in methods or fact sheets. Select a row in the table to bring up a comparison between the searched substance and the one selected from the table. If the searched substance itself was found in any documents, it will be in a bold font.
- Use the Filter minimum substance similarity selector at the top to hide results from the search that lack substances below the selected similarity threshold.

Figure 1: Search results for records containing cholesterol. A general search for "cholesterol" displays a list of matching records in the table (left). A selected record's mass spectrum is shown on the right. Please click here to view a larger version of this figure.
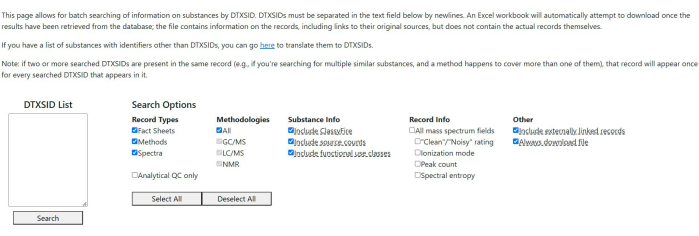
Figure 2: Batch search interface. The search field contains two substances identified by their DTXSIDs. Default search options are selected for the query. Please click here to view a larger version of this figure.
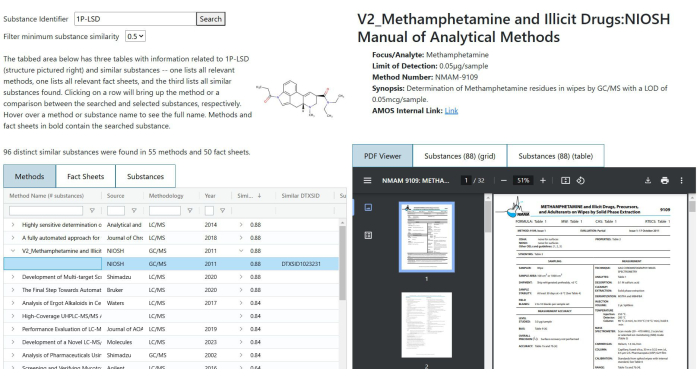
Figure 3: Structure search results for 1P-LSD. The table lists methods containing structurally similar substances. A selected method is displayed on the right. No bolded entries in the table indicate that 1P-LSD does not appear in any listed method. Please click here to view a larger version of this figure.
2. Searching for substances
- ClassyFire search: Perform this search to list all substances that belong to the given first four levels of a ClassyFire classification9 (see Figure 4).
- Using the four fields at the top of the page, select the top four levels of the classification one at a time. After selecting each of the first three, use the button below that field to get the list of classifications one level down. For the fourth, the button below will run the search.
NOTE: Once the search is complete, the table below will be populated by a list of substances that exist under that classification. The table includes common identifiers and substance information, plus counts of how many records exist in AMOS. - Use the buttons between the class selection and table to allow for four bits of functionality:
- Click on Copy Classification to URL to copy a URL to the clipboard, which, if loaded in a new browser tab or window, will automatically prepopulate the classification levels and run the search.
- Click on Reset Selection to reset the selections in the classification fields. It does not reset the table of found substances.
- Click on Download Table to prompt a download of a spreadsheet file containing all visible fields and records in the table, apart from the substance images. If the filters at the top of the result table are in use, the downloaded results will be filtered as well, but the contents of the filters will not be included.
- Click on Send Selected Substances to Batch Search to open a new tab for the batch search with the field for listing DTXSIDs prepopulated with the substances selected from the ClassyFire search results. Selection of individual substances can be done with the checkbox in each row; selection or deselection of all substances can be done by clicking the checkbox in the table's header. See step 1.2 for details on the batch search.
- Using the four fields at the top of the page, select the top four levels of the classification one at a time. After selecting each of the first three, use the button below that field to get the list of classifications one level down. For the fourth, the button below will run the search.
- Partial identifier search: Perform this to find all substances that match a non-unique identifier (see Figure 5). The current options are name substring (which covers both the EPA-preferred name and common synonyms), the InChIKey first block, the exact molecular formula, and a range of monoisotopic masses.
- At the top of the page, select an identifier and input the information into the adjacent field(s).
- Click on Search to run the search.
- When the search is complete, the table will be populated with a list of substances that match the partial identifier, plus information on how often they appear in AMOS's database and in other literature. Use the filters at the top of the table's columns to further refine the results, and use the Show multicomponent substances checkbox to show or hide substances that are comprised of multiple compounds.
NOTE: If a name substring search was run, a column listing the found synonyms will appear. If a substance is only found by synonyms - i.e., if the preferred name does not contain the substring - the preferred name will be italicized.
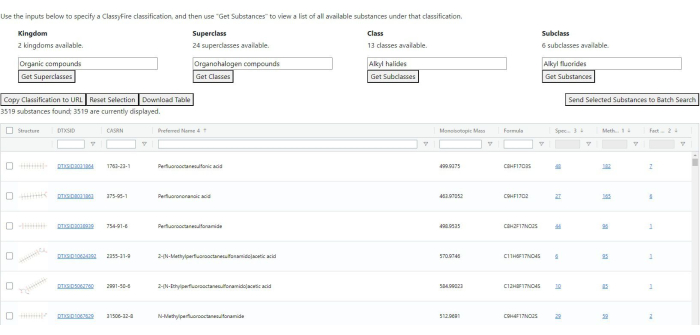
Figure 4: ClassyFire classification search results. Results include substance-level information and the number of records per classification group. Please click here to view a larger version of this figure.

Figure 5: Partial identifier search results for "trazine." The search retrieves substances with preferred names or synonyms containing the substring "trazine." Two of the three results include "trazine" only in their synonyms, not their preferred names. Please click here to view a larger version of this figure.
3. Searching through records
- Fact sheet and method lists: These pages list all fact sheets and methods that are in the database, with assorted ways of filtering them (see Figure 6). Since the functionality of the two pages is largely the same, they are grouped together here.
NOTE: Navigating to the page will prompt the tables to load. This may take a moment due to the number of records present.- Once a table is loaded, use the inputs at the top of each column to filter the data and various fields. The exact fields vary between tables, but most can be selected or filtered on.
- Use the Full Table Filter field above the table to check all columns for a certain string.
NOTE: The method list includes two fields that are hidden by default - author and publisher. The full table filter will catch records that have the searched term in either of those fields. - The fact sheet list allows for filtering individual results by searching for a given substance. Input a substance name, CASRN, InChIKey, or DTXSID, and hit search to filter the table. Click on Clear Filter to clear the substance filter.
NOTE: Both tables have the following buttons available: Copy Filters to Clipboard copies a URL to the clipboard that, when accessed by a browser, will load the list and prepopulate the filter fields in the table with the current values; Download Table downloads a list of all visible results and filters in the table; Download Substances downloads a list of all substances that appear in the (filtered) table; Reset Filters clears all table filters, including the full table filter.
- Mass spectrum search: Perform this search to retrieve a list of mass spectral matches from the database based on a user-supplied spectrum (see Figure 7).
- Fill in or adjust the four required input fields: a mass range for the target substance in Daltons, with a margin of error in either Daltons or parts per million (ppm); a methodology, either GC/MS or LC/MS; a mass spectrum, given as a list of charge-to-mass and intensity pairs; and the size of the mass window for peak similarity.
- Once those fields have been filled, click on the Search button below them.
NOTE: When the search is complete, if any spectra were found, a table will appear on the right side of the page listing spectra that match the selected methodology from all substances that match the mass range, sorted by the entropy similarity between the user-submitted spectrum and the database spectrum. - Select a row in the table to bring up a plot showing a comparison of the user spectrum with the database spectrum (respectively on the top and bottom of the plot). Use the Minimum similarity to show field to hide results that are below a given entropy similarity.
- Functional use classification visualization: This page visualizes AMOS' functional use ontology and links to the methods and fact sheets for those use classes. The classes are represented in a directed graph, with edges going from more general parent classes to more specific child classes (see Figure 8).
- Use the search field on the right side to search the list of functional use classes. Hover over a use class name to highlight the corresponding node in the graph.
- If examining the graph directly, hover over a specified node to bring up a short description of that class, as well as highlighting any direct parent or child classes for that node.
- Right-click on either a class name from the list on the right side of the page or a node in the graph to bring up a menu with options for the method and fact sheet lists. Select one of these, and a new browser tab will open to that list, with the functional class field pre-filtered with the selected functional class.
- Soil ternary plot: This page recreates the U.S. Department of Agriculture's soil texture classification, allowing for searching of AMOS's methods by soil type.
- Hover over the region of the plot to see details about its composition.
- Click a region of the plot to open a new tab to the method list with the matrix field pre-filtered on the selected soil classification.
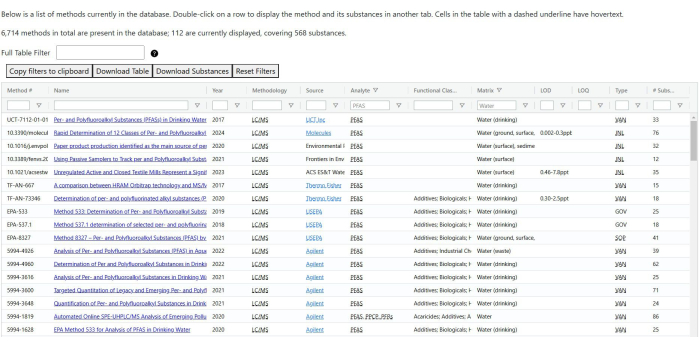
Figure 6: Filtered list of analytical methods. The table is filtered by analyte and matrix, displaying only methods related to PFAS (per- and polyfluoroalkyl substances) in water. The corresponding list of fact sheets closely resembles this layout. Please click here to view a larger version of this figure.
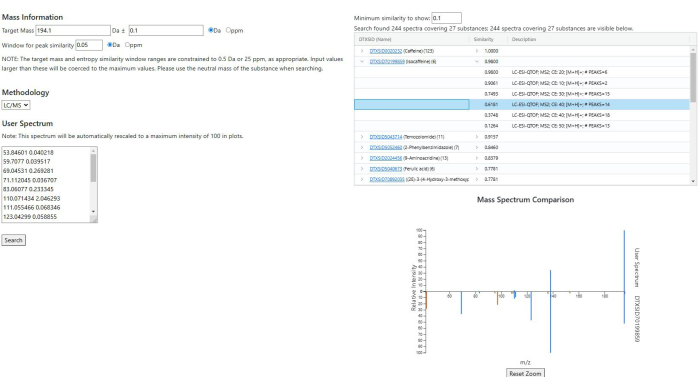
Figure 7: Spectrum similarity search results. A caffeine spectrum from the AMOS database is used as the input. Similar spectra are grouped by substance, with a maximum similarity score of 1.0. The mirrored plot shows the input spectrum (top) and a selected database spectrum (bottom). Light blue peaks are unique to the input, orange peaks to the database match, and dark blue peaks are shared. Please click here to view a larger version of this figure.
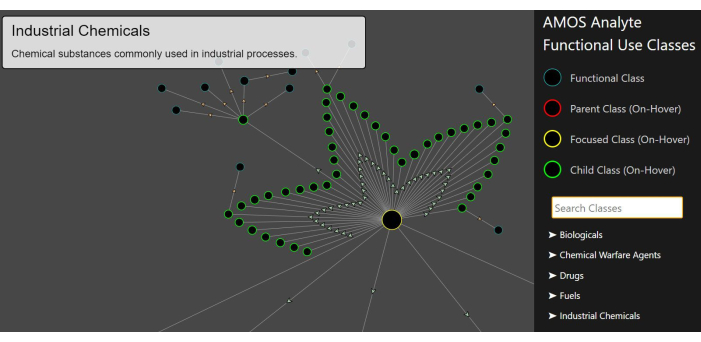
Figure 8: Functional use classification visualization. The hierarchical structure is shown with the cursor hovering over the "industrial chemicals" node (outlined in yellow). Its child classes are outlined in green. Please click here to view a larger version of this figure.
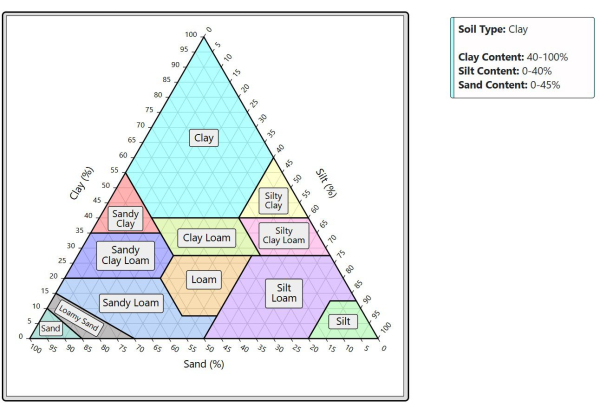
Figure 9: Soil ternary plot visualization. The plot displays compositional data for soil samples. A tooltip in the top-right shows the precise composition of the region currently under the cursor. Please click here to view a larger version of this figure.
Results
The screenshots of AMOS shown above show typical outcomes from the individual searches in the application, including both searches for substances of interest and among spectra, fact sheets, and methods. The variety of ways of interrogating the database is intended to cover the most likely and most useful kinds of searches in ways that allow for deeper investigation into the data and the substances that they relate to.
To assist a user's searching, much of the functionality is interconnected in ways intended to support deeper examination of the available data. As an example workflow, the functional use classification visualization links to views of the methods and fact sheets that are related to that functional class, from which lists of substances can be extracted and fed into the batch search, or individual documents can be examined, and individual substances in those documents can be investigated further. Since many substances in methods also have experimental mass spectra in the database, this can allow a researcher to quickly go from a category of substances to a set of methods and spectra that can test for the presence of a specific substance (see Figure 9).
Since the results will depend heavily on what is being searched for and which search or searches are run, representative results for the entire application are difficult to define. Overall, it may be more accurate to describe a "success" in terms of user experience; in that case, it is hoped that the following will generally hold true: That the methods of searching and filtering (and the ability to move between different searches and filters) are effective at identifying which subsets of information a user wants; that the results that the user finds are accurate and useful. Figure 10 depicts an example workflow demonstrating AMOS functionalities.
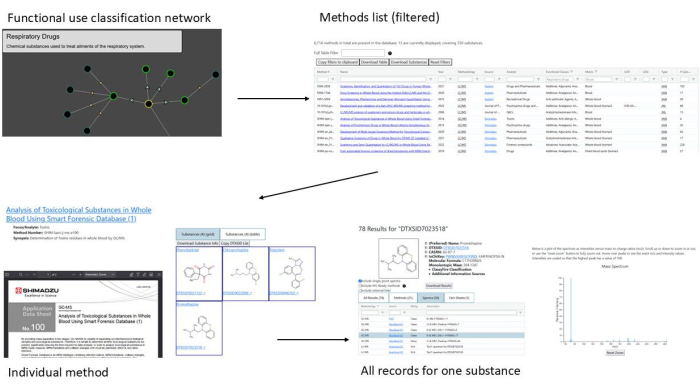
Figure 10: Example workflow demonstrating AMOS functionalities. The workflow begins with a functional use classification (respiratory drugs), filters methods related to respiratory drugs in blood, examines one specific method, and identifies spectra for a substance included in that method. Please click here to view a larger version of this figure.
Discussion
While many projects and applications focus on collecting and standardizing information from a single type of record, such as methods, fact sheets, or a specific kind of spectra, AMOS is the first tool identified that compiles and integrates large volumes of information across multiple record types. The unification, harmonization, and structuring of data from these diverse sources result in a database that can be more readily incorporated into workflows requiring access to analytical chemistry methodologies. The ability to search the database in several complementary ways enables efficient retrieval of information that might otherwise require extensive manual effort across multiple websites or tools.
Before public release, the utility of AMOS was demonstrated through its use by EPA staff to support a wide range of projects. The EPA has a sustained interest in the application of mass spectrometry for non-targeted analysis10,11, and multiple initiatives have leveraged the experimental mass spectra in AMOS to enhance searches against a large in silico spectral library generated from DSSTox chemicals12,13. Other projects have used structural similarity searching to identify starting points for developing new methods, examined existing methods to assess detection and quantitation limits, and analyzed collections of chemicals linked to methods to evaluate the extent of chemical space coverage.
AMOS' aggregation of potential training data further supports the development of quantitative models of amenability for analytical methods14, a core need for advancing non-targeted analysis (NTA) workflows. The curation efforts within AMOS also facilitate initiatives to model, explore, and visualize chemical spaces associated with methodological coverage14.
While the core functionality of AMOS is mature, ongoing development is guided by user feedback. Current tasks include the incorporation of additional data, curation of further metadata for enhanced filtering, and expansion of search capabilities. In collaboration with EPA stakeholders, application programming interfaces (APIs) are under development to enable programmatic access, addressing use cases where the graphical user interface (GUI) may be inefficient. A release notes page has been integrated into the application to track and communicate code updates over time.
New data records and chemicals are currently added on a weekly basis; however, a slower release schedule is anticipated following the public launch. While significant effort is made to ensure the accuracy of records and associated metadata, much of the data originates from public databases. As such, complete verification of every record is not feasible, and users should be aware that absolute data accuracy cannot be guaranteed.
Disclosures
This paper does not necessarily represent the views or policies of the U.S. Environmental Protection Agency.
Acknowledgements
The authors thank the curation team for all their work curating chemicals for the database, and Joshua Powell, Asif Rashid, and Freddie Valone for technical support in the construction and deployment of AMOS. We also thank Charles Lowe for his review of the manuscript.
Materials
| Name | Company | Catalog Number | Comments |
| Git | N/A | https://git-scm.com/ | Open-source version control system. |
| JavaScript | N/A | https://ecma-international.org/publications-and-standards/standards/ecma-262/ | Programming language. Defined by ECMA International standards. |
| PostgreSQL | PostgreSQL Global Development Group | https://postgresql.org/about/licence | Open-source database management system. |
| Python | Python Software Foundation | https://www.python.org/ | Open-source programming language. |
References
Reprints and Permissions
Request permission to reuse the text or figures of this JoVE article
Request PermissionExplore More Articles
This article has been published
Video Coming Soon
Copyright © 2025 MyJoVE Corporation. All rights reserved